
Chapter 7 Population and Migration for print only
Understanding how the human population is organized geographically helps us make sense of cultural patterns, the political organization of space, food production issues, economic development concerns, natural resource use and decisions, and urban systems. Additionally, themes of location, space, place, the scale of analysis, and pattern can be emphasized when studying fundamental population issues such as crude birth rates, crude death rates, total fertility rate, infant mortality rates, doubling time, and natural increase.
Explanations of why the population is growing or declining in some places are based on patterns and trends in fertility, demographic mortality, and migration. Analyses of refugee flows, immigration, and internal migration help us understand the connections between population phenomena. For example, environmental degradation and natural hazards may prompt population redistribution at various scales, which in turn creates new pressures on the environment, culture, and political institutions.
This chapter will analyze population trends across space and time as ways to consider models of population growth and decline, including Malthusian demographic transition, and the epidemiological (mortality) transition model.
Essential understanding and Learning Objectives
- Knowledge of the geographic patterns and characteristics of human populations facilitates an understanding of cultural, political, economic, and urban systems.
- Populations grow and decline over time and space.
- Causes and consequences of migration are influenced by cultural, demographic, economic, environmental, and political factors.
Population Growth
Geographers study where and why people live in particular locations. Neither people nor resources are distributed uniformly across Earth. In regards to population growth, geographers emphasize three elements: the population size; the rate of increase of world population; the unequal distribution of population growth. Geographers seek to explain why these patterns exist.
The subject of overpopulation can be highly divisive given the deep personal views that many hold on abortion. This course emphasizes a geographic perspective on population growth as a relative concept. Population, from a geography perspective, should be viewed in the context of the availability of resources. Human-environment interaction and overpopulation can be discussed in the contexts of carrying capacity, as well as the relationship between people and resources.
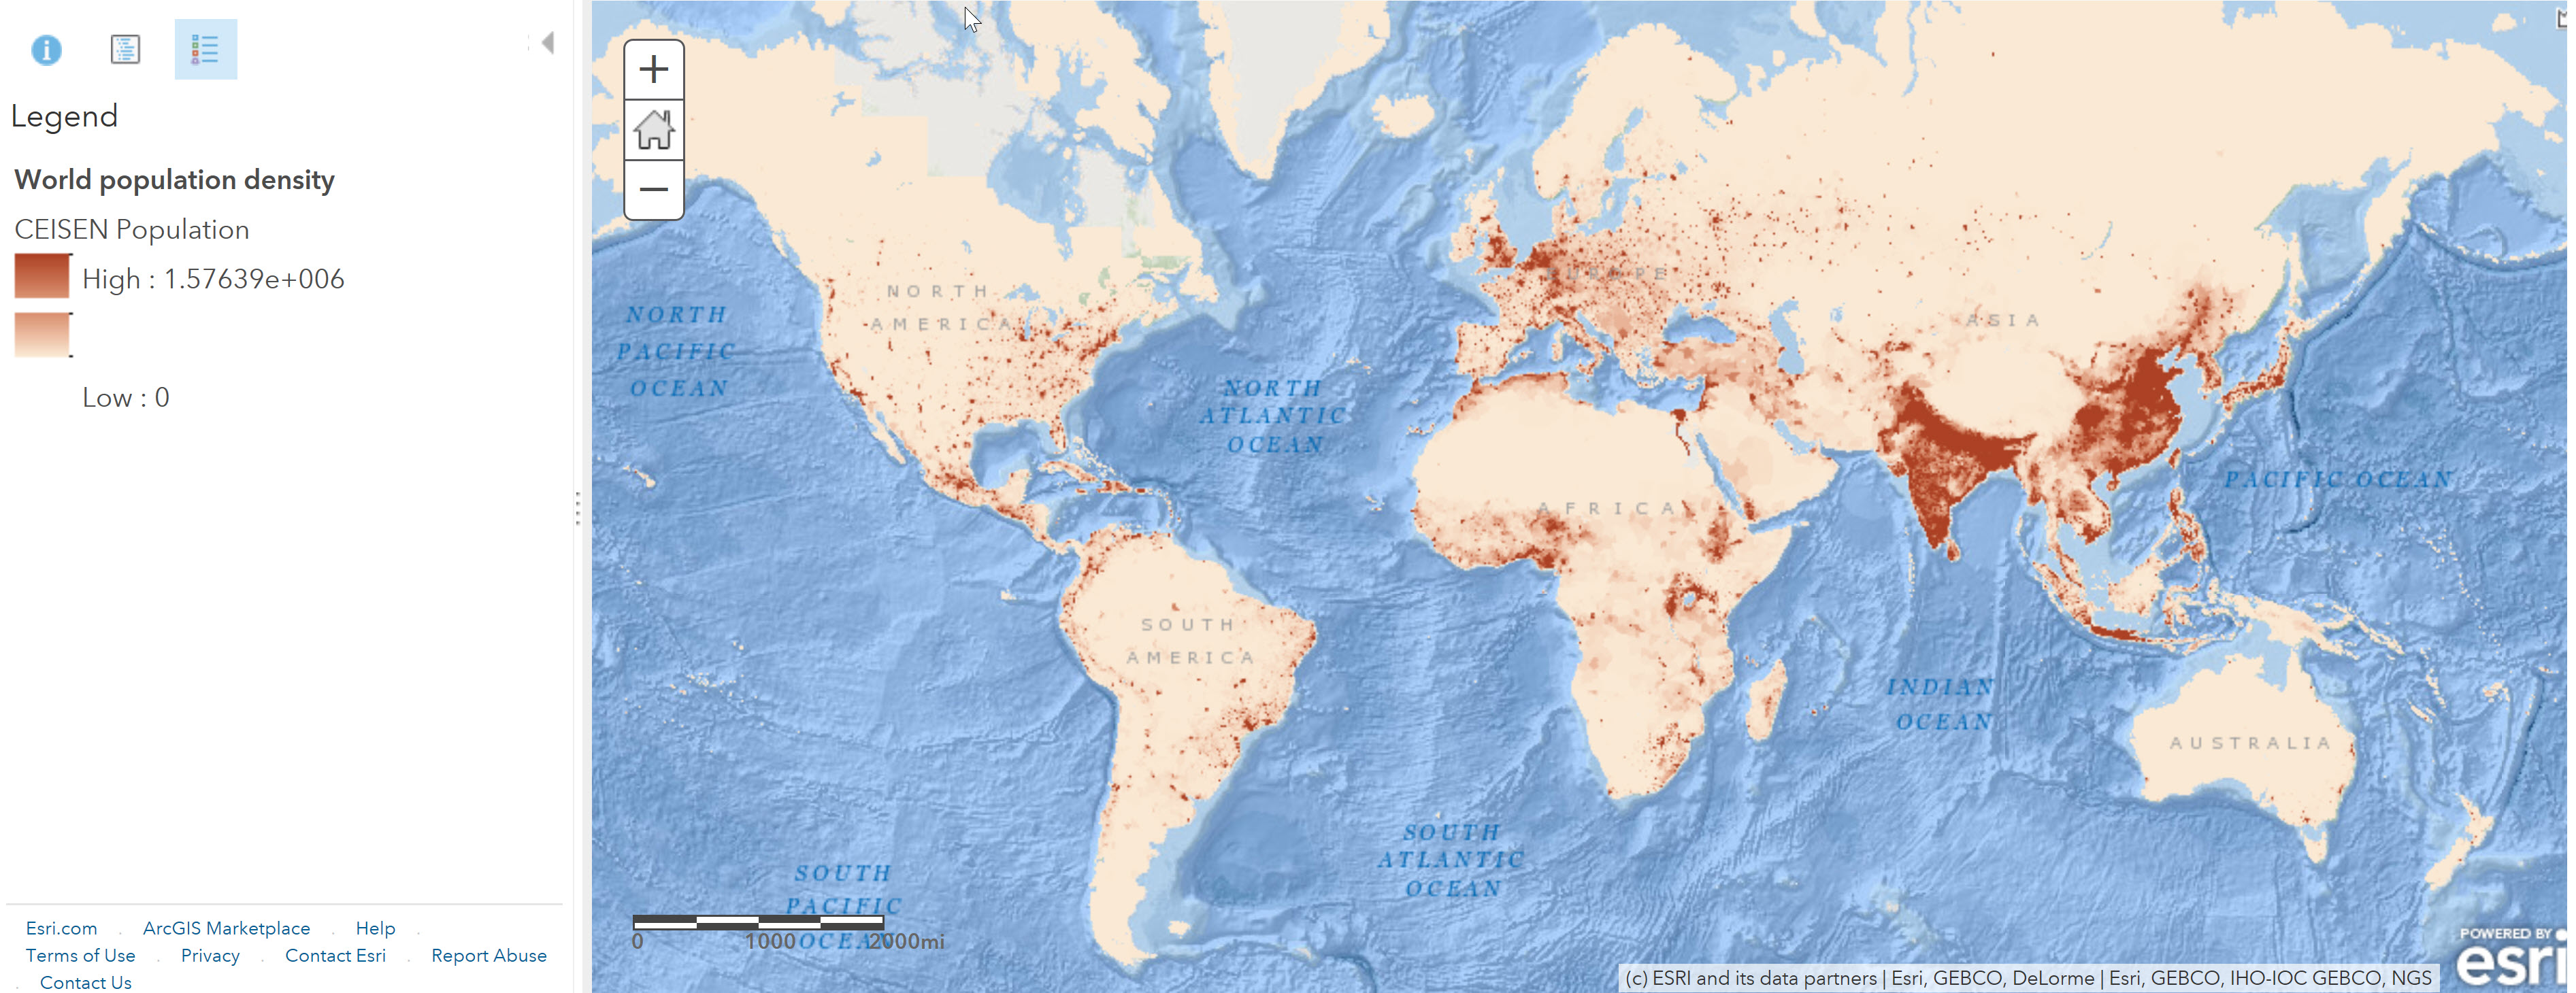
The study of population has never been more important than it is today. There are over 7 billion people on the planet, but the majority of this growth has occurred in the last 100 years, mostly in developing nations. Humans do not live uniformly around the planet, but rather in clusters because of earth’s physical geography. Environments that are too dry, wet, cold, or mountainous create a variety of limiting factors to humans. Two-thirds of the world’s population is located within four major clusters: East Asia (China), South Asia (India and Indonesia), Southeast Asia, and Europe, with the majority in East and South Asia.
Demographers, scientists that study population issues, and other scientists say there is more to the story than simple population growth. Ecologists believe that humans have out-grown the Earth’s carrying capacity, which is a scientific way of saying that the planet can no longer sustain or support human activity. Simply put, there is just not enough of the world’s resources to give every human a standard of living expected by most Americans. If fact, if all 7 billion people on the planet lived the average American lifestyle, it would require over three Earth’s. This raises several issues: that the planet cannot sustain a population of 7 billion, though we are expected to reach 9 billion by 2100, and that the planet cannot sustain Western lifestyles for the entire planet.
7.1: Where Humans Live
Humans only occupy five percent of the Earth’s surface because oceans, deserts, rainforests, and glaciers cover much of the planet. The term for areas where humans permanently settle is called ecumene. Population growth and technology dramatically increase the ecumene of humans, which affects the earth’s surface and natural systems.
Issues and concerns of growing human populations have less to do with space and more to do with habitual locations and access to natural resources. All 7.57 billion people on the planet could live within an area the size of Los Angeles, California, but that is not desirable, sanitary, or sustainable. The reality is that humans cannot live in many parts of the world due to moisture, temperature, mountains, or growing season issues. Twenty percent of the world is too dry to support humans. This mostly has to do with large-scale high-pressure systems around 30 degrees north and south of the equator where constant sunny conditions have created some of the world’s largest deserts. Some of these include the Sahara, Arabian Peninsula, Thar, Takla Makan, and Gobi deserts. Most deserts do not provide enough moisture to support agriculture for large populations. Those who do live in these regions tend to raise animals and are considered nomads.
Regions that receive too much moisture also cause problems for human settlement. These are tropical rainforest regions located between the Tropic of Cancer (23.5 degrees North) and the Tropic of Capricorn (23.5 degrees South). The problem with these regions of the world has to do with the soil erosion due to high precipitation. High levels of precipitation greatly hinder agricultural production because nutrients in the soil are quickly washed away. This is partly why slash-and-burn agriculture occurs in these regions. Locals will burn part of the forest to put nutrients back into the ground. This only works for a short period because the precipitation washes away nutrients within a few years, so farmers move on to other parts of the forest with their slash-and-burn practices.
Additionally, regions that are too cold pose problems for large population clusters and food production. The cold polar regions have a short growing season, snow cover, permanently frozen land called permafrost, or high-pressure systems near the poles that limit the amount of moisture an area receives. Thus, cold polar regions are not only limited by temperature, but they are also limited by lack of moisture despite access to snow, ice, and glaciers. Mountainous and highland regions lack population clusters for similar reasons: steep slopes, snow and ice cover, and short growing seasons.
Because of these environmental factors, two-thirds of the world’s population is clustered into four geographic regions: Europe, East Asia, South Asia, and Southeast Asia. In Europe, three-fourths of people living there live in cities. In East Asia, most of the people live near coastal regions by the Pacific Ocean or near major river systems. Over half of the people in East Asia live in rural areas and are likely to be farmers. Similar to East Asia, people living in South Asia live near major river systems such as the Ganges and Indus rivers in order to have access to water for farming. Southeast Asia is quite different from the other three regions because most of the people live on islands within the Pacific and Indian oceans. But similar to East Asia and South Asia, the majority of people living in Southeast Asia live in rural areas and are likely to be farmers.
7.2: Global Population Trends
Agricultural density refers to the number of farmers valuable to arable land. A high agricultural density suggests that the available agricultural land used for farming and the farmers who are capable of producing and harvesting food is reaching its limit for that region. If the demand for food continues or rises, the risk is that there will not be enough arable land to feed their people. In contrast, an area with a low agricultural density has a higher potential for agricultural production. Economically, a low agricultural density would be favorable for future growth. Developed countries tend to have a much lower agricultural density because of technology. When geographers study and compare physiological and agricultural densities, they can analyze and determine the relationship between a country’s population and resources.
7.3 POPULATION PYRAMIDS
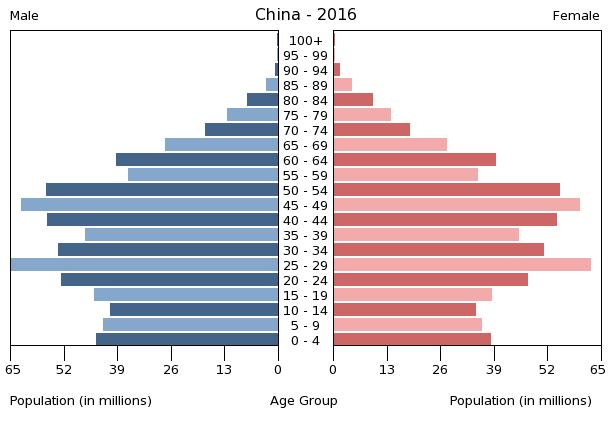
A useful and critical tool used by scientists that focus on demographics, this included geographers, demographers, and social scientists, is a population profile called a population pyramid. A population pyramid visually demonstrates a particular region’s demographic structure about males and females and is often expressed in numbers or percentages. The following are some characteristics of population profiles:
- A bell-shaped graph will indicate that a country has experienced high population growth in the early past but is experiencing a slow decrease.
- Pyramids with a large base indicate countries with high population growth.
- As a country’s population boom begins to age, a strange profile shape can develop with a wider top and a narrower base.
- Populations that have stabilized have profiles where the majority of the pyramid is uniform in shape and gets smaller towards the top.
- When a country has a large immigrant population, specifically “guest workers” than usually tend to be men, the male side of the graph will be dramatically wider than the women side of the graph.
If a country has experienced war, a catastrophic disaster, or a genocide that eliminates an entire generation, that generation will have a smaller number or percent than the generations before or after. For example, a major war may cause a reduction in populations in their mid-20s and 30s, and potentially a greater loss of males, which would appear on the profile graph.

STRUCTURAL CHANGES OF POPULATIONS
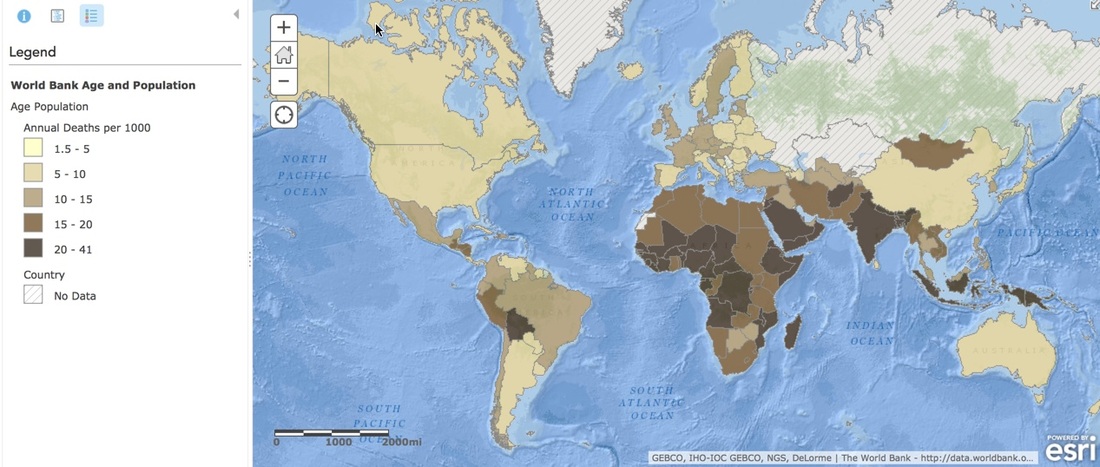
Before we look at the model used to analyze how populations change, it is essential to look at key factors that influence the structure of a population. A region’s population will grow as long as their crude birth rates are greater than their crude death rates. A crude birth rate (CBR) is the total number of live births for every 1,000 people in a given year. So a crude birth rate of 10 would mean ten babies are born every year for every 1,000 people in that region. Crude death rates (CDR) are the total number of deaths per 1,000 people in a given year.
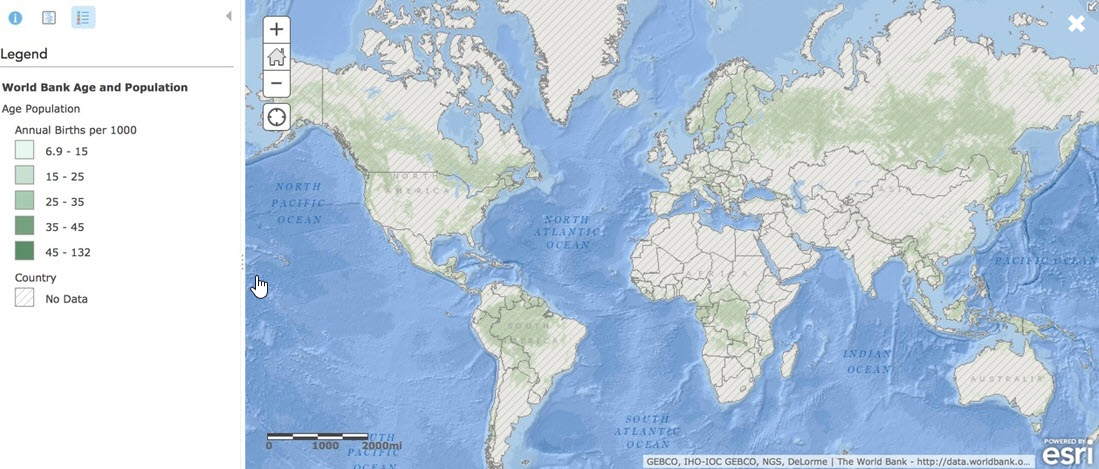
When CBRs are compared to CDRs, a region’s natural increase rate can be determined. A natural increase rate (NIR) is the percent a population will grow per year, excluding annual migration. Usually, a NIR of 2.1 is required to maintain or stabilize a region’s population. Any more than that and the population will grow, any less than a NIR of 2.1 causes population contraction. The reason why the NIR percent is 2.1 and not 2.0 for stability is because not every human will pair up and have a child because of genetics, choice, or death before childbearing years. Once we know the NIR, we can determine doubling time. Doubling time is the how many years would it take for a defined population to double in size, assuming that NIR stays the same over time. Over 95 percent of the world’s natural increase is occurring in developing countries. Subsaharan Africa and parts of Southwest Asia have NIR over 2.0, leading to large population growth, whereas regions in Europe have NIR near zero causing the population to decline. Currently, about 75 million people are added to the world’s global population every year.
The total fertility rate (TFR) is the average number of children a woman would be expected to have during the childbearing years (between 15-49 years old). The global average for TFRs is about 2.5, but in developing countries, it is as high as 5.0 or higher, and in more developed countries it is as low as 2.0 or less. The total fertility rate is a direct expression of a nation’s health care system because it reflects a population’s access to doctors, nurses, hospitals, and medicine.
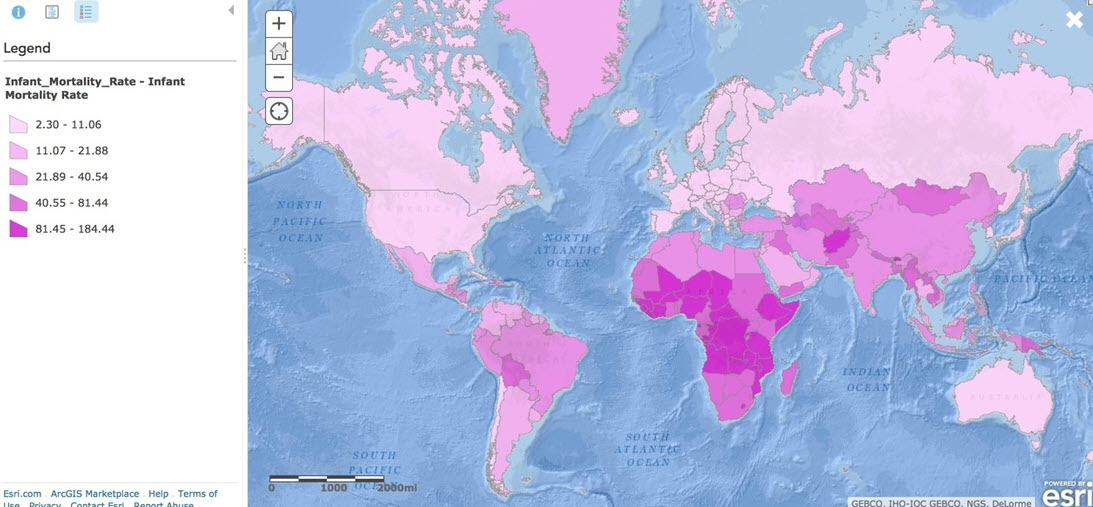
The next important term to understand is the infant mortality rate (IMR). The IMR is determined by calculating how many children die before the age of 1 per 1,000 live births annually. The highest IMRs are in developing countries where rates can be as high as 80 or more. Conversely, in regions like Europe, it is as low as 5 per 1,000 live births annually.
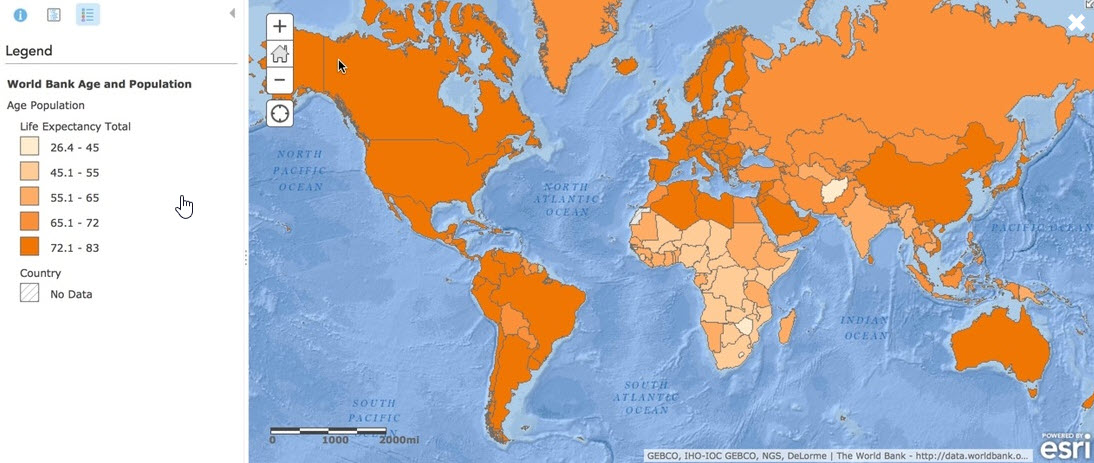
Life expectancy at birth is an average of how many years a newborn is expected to live, assuming that mortality rates stay consistent. In more developed countries, the average life expectancy is over 80 years old, and in developing countries, it is only around 40 years. When we compare CBRs, CDRs, and TFRs, we find that the world has a large population of youth with the largest percent in developing countries. This causes high stress on the education systems and to some extent the health care systems within more impoverished countries.
However, more developed countries tend to have older demographics, which tends to cause stresses on the health care and social safety nets of those countries. The dependency ratio discussed later in this chapter, is used to understand these stresses and is the number of people who are too young or too old to work compared to the number of people who are in their “productive years.” The larger the ratio, the higher the economic stress on those nations.
7.4 Demographic Theories
Geographers and other social scientists have long looked at population issues as central to understanding human interactions. Below we will look at four theories about population that inform sociological thought: Malthusian, zero population growth, cornucopian, and demographic transition theories.
Demographic Transition Model
Whether you believe that we are headed for environmental disaster and the end of human existence as we know it, or you think people will always adapt to changing circumstances, we can see clear patterns in population growth. Societies develop along a predictable continuum as they evolve from unindustrialized to postindustrial. Demographic transition theory (Caldwell and Caldwell 2006) suggests that future population growth will develop along a predictable four-stage model.
Human geographers have determined that all nations go through a four-stage process called the Demographic Transition Model (DTM). The DTM’s function is to demonstrate the natural sequence of population change over time-based on development and modernization. This can help geographers, and other scientists examine the causes and consequences of fertility, mortality, and natural increase rates. Though controversial, the DTM has been used as the benchmark for forecasting human population growth regionally and globally.

STAGE 1: LOW GROWTH RATE
Humans have lived in the first stage of the DTM for most of our existence. In this first stage, CBRs and CDRs fluctuated greatly regionally, globally, and over time because of living conditions, food output, environmental conditions, war, and disease. Ultimately, the natural increase of the world was stable because CBRs and CDRs were about equal. However, around 8,000 BC, the world’s population began to grow dramatically due to the agricultural revolution. During this time, humans learn to domesticate plants and animals for personal use and became less reliant on hunting and gathering for sustenance. This allowed for more stable food production and allowed village populations to grow. War and disease prevented population growth from occurring on a global scale.
STAGE 2: HIGH GROWTH RATE
Around the mid-1700s, global populations began to grow ten times faster than in the past because of the Industrial Revolution. The Industrial Revolution brought with it a variety of technological improvements in agricultural production and food supply. Increased wealth in Europe, and later North America, because the Industrial Revolution meant that more money and resources could be devoted to medicine, medical technology, water sanitation, and personal hygiene. Sewer systems were installed in cities; thus public health improved. All of this dramatically caused CDRs to drop around the world. At first, CBRs stayed high as CDRs dropped, this caused populations to increase in Europe and North America. Over time, this would change.
Africa, Asia, and Latin America moved into Stage 2 of the demographic transition model 200 years later for different reasons than their European and North American counterparts. The medicine created in Europe and North America was brought into these developing nations creating what is now called the medical revolution. This revolution or diffusion of medicine to this region caused death rates to drop quickly. While the medical revolution reduced death rates, it did not bring with it the wealth and improved living conditions, and development that the Industrial Revolution created. Global population growth is most significant in the regions that are still in Stage 2.
STAGE 3: MODERATE GROWTH RATE
Today, Europe and North America have moved to Stage 3 of the demographic transition model. A nation moves from Stage 2 to Stage 3 when CBRs begin to drop while CDRs remain low or even continue to fall. It should be noted that the natural rate of increase in nations within Stage 3 is moderate because CBRs are somewhat higher than CDRs. The United States, Canada, and nations in Europe entered this stage in the early 20th Century. Latin American nations entered this stage later in the century.
Advances in technology and medicine cause decrease in IMR and overall CDR during Stage 2. Social and economic changes bring about a decrease in CBR during Stage 3. Countries that begin to acquire wealth tend to have fewer children as they move away from rural-based development structures toward urban-based structures because more children survive childhood and the need for large families for agricultural work decreases. Additionally, women gained more legal rights and chose to enter the workforce, own property, and have fewer children as nations move into Stage 3.
STAGE 4: LOW GROWTH RATE
A country enters Stage 4 of the demographic transition model when CBRs equal to or become less than CDRs. When CBRs are equal to CDRs, a nation will experience zero population growth (ZPG). This occurs in many countries where girls do not live as long before they reach their childbearing years due to gender inequality.
A country in the first two stages of the transition model will have a broad base of young people and a smaller proportion of older people. A country in Stage 4 will have a much smaller base of young people (fewer children), but a much larger population of elderly (decreased CDR). A country with a large youth population is more likely to be rural with high birthrates and possibly high death rates; helping geographers analyze a nation’s health care system. Moreover, a country in Stage 4 with a large elderly population will have much fewer young people supporting the economy. These two examples represent the dependency ratio, mentioned earlier in this chapter. This ratio is the number of people, young and old, who are dependent on the working force.
Human geographers like to focus on the following demographic groups: 0-14 years old, 15-64 years old, and 65 and older. Individuals who are 0-14 and over 65 are considered dependents (though this is changing in older generations). One-third of all young people live in developing nations. Moreover, this places great strain on those nations’ infrastructure such as schools, hospitals, and day-care. Older individuals in more developed nations (MDL) benefit from health care services, but require more help and resources from the government and economy.
Another ratio geographers look at is the number of males compared to females, called the sex ratio. Globally, more males are born than females, but males have a higher death rate than females. However, understanding a country’s sex ratio and their dependency ratio helps human geographers analyze fertility rates and natural increase.
As noted earlier, population growth has increased dramatically in the last century. No country is still in Stage 1, and very few have moved into Stage 4. The majority of the world is either in Stage 2 or 3, which both have higher CBRs than CDRs; creating a human population over 7.5 billion today.
STAGE 5: DECLINE
Many demographers believe a new stage in the DTM should be added to address issues starting to develop in countries within Europe and Japan. In this final stage, CBR would be extremely low and an increasing CDR. This would cause the area’s NIR to potentially become negative, leading to declining population growth. This may create an enormous strain on the social safety net programs of a country as is tries to support older citizens who are no longer working and contributing to the economy.
Currently, most of Europe has entered Stage 4. The United States would be approaching this stage if it were not for migration into the country. The first country that would enter Stage 5 would be Japan.
In summary, the demographic transition model is a model that helps human geographers understand and predict the demographics of individual nations. In Stage 1, CBR and CDR are very high and thus produce a low natural increase. In Stage 2, a nation’s CBR stays relatively high, but the CDR drops dramatically, producing the highest growth in population. In Stage 3, CDR stays low; however, changes in social customs and economic conditions. Finally, nations in Stage 4 have nearly equal CBR and CDR (sometimes higher CDR), creating a drop in natural increase.
Malthusian Theory
Overpopulation occurs when the number of people in an area exceeds the carrying capacity of the environment to support life at a decent standard of living. Thomas Malthus (1766–1834) was an English clergyman who made dire predictions about earth’s ability to sustain its growing population. According to Malthusian theory, three factors would control human population that exceeded the earth’s carrying capacity, or how many people can live in a given area considering the amount of available resources. Malthus identified these factors as war, famine, and disease (Malthus 1798). He termed them “positive checks” because they increase mortality rates, thus keeping the population in check. They are countered by “preventive checks,” which also control the population but by reducing fertility rates; preventive checks include birth control and celibacy. Thinking practically, Malthus saw that people could produce only so much food in a given year, yet the population was increasing at an exponential rate. Eventually, he thought people would run out of food and begin to starve. They would go to war over increasingly scarce resources and reduce the population to a manageable level, and then the cycle would begin anew.
Of course, this has not exactly happened. The human population has continued to grow long past Malthus’s predictions. There are three reasons sociologists believe we are continuing to expand the population of our planet. First, technological increases in food production have increased both the amount and quality of calories we can produce per person. Second, human ingenuity has developed new medicine to curtail death from disease. Finally, the development and widespread use of contraception and other forms of family planning have decreased the speed at which our population increases.
Some still believe Malthus was correct and that ample resources to support the earth’s population will soon run out. While new technologies have helped to increase food production, there are not enough emerging technologies to handle supply and demand. Adding to the problem is the fact that many insects have developed a resistance to pesticides. These problems have caused a slowdown and leveling off of food production in many regions of the world. Without breakthroughs in safe and sustainable food production, food supply will not keep up with population growth.
Others believe that population growth is not a bad thing. A large population could stimulate economic growth, and therefore, production of food. Population growth could generate more customers and more ideas for improving technology. Additionally, some maintain that no cause-and-effect relationship exists between population growth and economic development. They argue that poverty, hunger, and other social welfare problems associated with a lack of economic development, famines, and war are a result of unjust social and economic institutions, not population growth.
Zero Population Growth
A neo-Malthusian researcher named Paul Ehrlich brought Malthus’s predictions into the twentieth century. However, according to Ehrlich, it is the environment, not specifically the food supply, that will play a crucial role in the continued health of planet’s population (Ehrlich 1968). Ehrlich’s ideas suggest that the human population is moving rapidly toward complete environmental collapse, as privileged people use up or pollute a number of environmental resources such as water and air. He advocated for a goal of zero population growth (ZPG), in which the number of people entering a population through birth or immigration is equal to the number of people leaving it via death or emigration. While support for this concept is mixed, it is still considered a possible solution to global overpopulation.
Epidemiological Transition Model
One problem with the Demographic Transition Model is that it poorly considers health threats to populations within each stage. The epidemiological transition addresses precise health threats to countries in demographic transition. Said another way, it focuses on specific causes of death within each stage of the DTM. Epidemiology is a branch of health science that analyzes the causes, distribution, and control of disease in a population. Researchers in epidemiology have a strong background in geography and spatial science.
STAGE 1: PESTILENCE AND FAMINE
Infectious diseases and parasites are the greater killers of humans on the planet. The greatest epidemic in human history was the Black Plague, which killed nearly a half of Europe’s population between 1347 and 1350. It is believed that 25 million people died in those three years.
STAGE 2: RECEDING PANDEMICS
A pandemic is an epidemic of infectious disease that has spread across a large region, affecting high proportions of the population. Diseases like cholera and malaria greatly impact countries in Stage 2 of the DTM because of overcrowding, contaminated water sources, and lack of a strong health care infrastructure.
STAGE 3: DEGENERATIVE DISEASES
The causes of death for countries in Stage 3 of the DTM tend to be more from chronic disorders related to age and less from infectious diseases. Rather than dying from cholera, malaria, AIDS, or Ebola, populations in Stage 3 die from cancer or cardiovascular diseases such as heart attacks. The reason why countries in Stage 2 die less from degenerative diseases is that their life expectancy is much shorter.
STAGE 4: DELAYED DEGENERATIVE DISEASES
Though degenerative diseases still exist for countries in this stage, medical advances and technology prolong the life expectancy further than countries in the third stage. Delayed degenerative diseases are reduced further as society makes lifestyle changes in health regarding diet, tobacco and alcohol consumption, and exercise.
7.5 FUTURE OF POPULATION GROWTH

As noted earlier, the United States Census Bureau estimates that the world population is roughly 7.57 billion people. Governments and other entities can dramatically influence population change as a way to increase or decrease population growth in a particular country. For example, some countries take dramatic steps to reduce their population. China’s One-Child Policy dictated that each family (husband and wife) could legally have only one child. Families that followed this policy were often given more money by the government or better housing. If a family illegally had another child, the family would be fined heavily. Children born illegally cannot attend school and have a difficult time finding jobs, getting government licenses, or even getting married. Some have reported that the government would force abortions on families with more than one child. One of the significant consequences of this policy was a dramatic increase in abortions and infanticides, especially of females. Female infanticide is linked directly to a global cultural trend that privileges males over females—baby boys are desired, especially if the family is only allowed, one child. This specific focus on eliminating women is called gendercide. Half the Sky, written by Nicholas Kristof and Sheryl WuDunn, documents global gendercide and what is being done to combat this problem.
After the two great world wars, the United Nations Population Commission and the International Planned Parenthood Federation began to advocate for more global population control. Many groups who advocate for population control focus on:
- Changing cultural attitudes that keep population rates high (or low)
- Providing contraception to developing countries
- Helping countries study population trends by improving census counts
- Empowering women and emphasizing gender equality
It is believed that worldwide, over 60 percent of women between ages 15-49 use some form of contraception, though this varies regionally. In the United States, contraception use is at nearly 75 percent, whereas in Africa it is around 30 percent. The consensus today is that the focus on population planning should be on gender equality and improving the social status of women around the world. This is the focus of the International Conference on Population and Development. Religious organizations are also concerned with population growth; however, they focus on contraception issues and not strictly population growth. Some religions and political entities find contraception use immoral, which has influenced some governments to make access to them and use of them illegal.
7.6: Global Migration
Migration, a form of relocation diffusion, is defined as the permeant movement of people to a new location. Emigration is a form of migration from a particular location. Immigration is the migration to a new location. The numerical difference between emigration and immigration is called net migration.
Though geography does not have a comprehensive theory on migration, nineteenth-century geographer, E. G. Ravenstein created a few migration laws that can help us understand migration. These rules focus on the distance people migrate, the reasons why they relocate, and the characteristics of migrants.
DISTANCE OF MIGRATION
Most people that migrate travel only a short distance from their original destination and usually within their country, usually due to economic factors. This is called internal migration. Internal migration can be divided up even further into interregional migration (the permanent movement from one region of a country to another region) and intraregional migration (the permanent movement within a single region of a country). The other type of migration is called international migration, which is the movement from one country to another. Roughly 10 percent of the people in the world are international migrants, meaning they currently live in a country they were not born in.
Some people are allowed to voluntarily migrate based on individual choice. At other times, a people relocate against their will, called forced migration. Ultimately, the distance people migrate is depends on economic, gender, family status, and cultural factors. For example, long-distance migration tends to involve males looking for employment and traveling by themselves rather than risk taking their families.
Migration is very dynamic around the world with peaks in different regions at different times. There are several reasons why people migrate to someplace or from someplace. Migration transition is the change in migration patterns within a society caused by industrialization, population growth, and other social and economic changes that also produce the demographic transition. A critical factor in all forms of migration is mobility, the ability to move either permanently or temporarily. Most international migrants come from countries in Stage 2 of the Demographic Transition Model, whereas internal migrants tend to originate from countries in Stage 3 or 4 of demographic transition.
There has been a dramatic increase in immigration into the United States from Latin America, Africa, and the Middle East. Some from these regions migrate to the U.S. out of economic necessity. We hear quite a lot about guest workers in the United States. These are individuals who migrate temporarily to take up jobs in other countries. Others migrate to escape conflicts such as the civil wars in Somalia, Sudan, and Ethiopia. Genocides in Rwanda (1994) and more recently Darfur, Sudan have forced internal and international migration. The wars in Afghanistan and Iraq have also forced migration from these regions. Washington Post reporter Sudarsan Raghavan reported on February 4, 2007, that the U.N. High Commission for Refugees estimates that over 2 million Iraqis (nearly 8 percent of the pre-war population) have been forced to migrate to nearby nations of Jordan, Syria, and Lebanon.
7.7 CAUSES OF MIGRATION
There are several reasons why people migrate, and these are called push and pull factors, and they usually occur because of an area’s political, economic, cultural, or environmental conditions. Push factors are events and conditions that compel an individual to move from a location. Pull factors are conditions that influence migrants to move to a particular location. The number one reason why people migrate is for economic reasons. This is because people either get “pushed” away from where they live due to a lack of employment opportunities or pulled because somewhere else either offer more jobs/higher paying jobs.
Cultural and political push factors usually involve slavery, political instability, ethnic cleansing, famine, or war. People who choose to flee or are forced to flee as a result of these problems are often called refugees. The United States Committee for Refugees classifies a refugee as someone who has been forced from their homes and cannot return because of their religion, race, nationality, or political opinion. In 2010, the United Nations High Commission for Refugees estimated that there are over 44 million people worldwide that have been forcibly displaced. The number grows to another 27 million when internally displaced persons are factored in. An internally displaced person (IDP) is someone who has been forced to migrate, but has not migrated across an international border. Some migrants are considered asylum seekers, who are people that have migrated to another country in hopes of being recognized as a refugee. Political or cultural pull factors could include people who want to live in democratic societies, gender equality, or educational or religious opportunities.
A variety of environmental push and pull factors also influence migration patterns. Environmental pull factors can include people wanting to live in particular environments. For example, many older adults like to live in southwestern states in the United States because they prefer the recreational opportunities that are provided for retired individuals. Some people want to live where snow activities are available or near an ocean.
Push factors often are related to the frequency of natural disasters such as earthquakes, tsunamis, hurricanes, or flash floods that a region could experience. Climatic push and pull factors, such as droughts, also influence migration patterns. A very recent example of this is the famine in Somalia. The main reason for environmental refugees is because of water; either too much or not enough. Sometimes people who want or need to relocate find various intervening obstacles, which are environmental or cultural features of the landscape that hinders migration.
The United States Agency for International Development (USAID) and the Famine Early Warning System track potential famines globally so that relief organizations can have a heads up and be more proactive when events occur. People who have been pushed for environmental reasons are called environmentally displaced persons (also called environmental refugees). The problem with these refugees is that they are not protected or given the same rights under the 1951 Refugee Convention. Under the convention, a refugee is a person with: “well-founded fear of being persecuted for reasons of race, religion nationality, membership of a particular social group or political opinion, who is outside the country of his nationality and is unable o, owing to such fear, is unwilling to avail himself of the protection of that country.” However, more and more people are becoming environmental refugees because of climate change, droughts, flooding from massive storm systems, water shortages, and more.
MIGRANT WORKERS
As mentioned earlier, most people relocate for economic push or pull factors. The United States, Canada, and Europe are primary locations migrants seek to relocate to for economic reasons. A struggle that many countries try to address is determining if a migrant is seeking economic opportunities or refugees fleeing governmental persecution. This distinction is important because many developed countries, including the United States, treat those two categories differently. Migrants who seek economic opportunities are less likely to be allowed into a country unless they provide a specific skill set the economy needs. If they are allowed into a country, it usually is on a temporary basis. Whereas, refugees receive special priorities with being allowed into a country and are more often than not, allowed to stay permanently.
A common practice of migrants who find work in another country will send a portion of their wages to family members back home. When migrants transfer money back to their home of origin, it is called remittance.
7.8 GENDER, AGE, AND EDUCATION
Ravenstein theorized that males were more likely to migrate than females, the longer the distance to relocate. The idea is that men are more likely to find employment than women. For much of human history, this was actually the case. But in the 1990s, gender patterns regarding migration began to change. Now, more women migrate to the United States than males.
Ravenstein also believed that long-distance migration occurred more with young adults, rather than children and elderly. In the United States, over 40 percent of immigrants are young adults. Children make up roughly 16 percent, and elderly make up less than 5 percent of immigration into the United States.
There is a growing concern of unaccompanied minors, between 12 to 17 years old in age, migrating to the United States. The majority of them are males, coming from Honduras and El Salvador because of gang violence.
Unauthorized Immigration
The political border between the United States and Mexico is 1,951 miles long. Currently, the United States has built various barriers along roughly one-quarter of the border. Protection of the border consists of a variety of technologies and resources including steel fences, drones, check-points, and immigration officers.
As noted earlier, the United States would be nearly the end of Stage 3 in the Demographic Transition Model if it were not for immigration. The desire to migrate to the United States continues to grow, but many cannot enter the country legally. Those who enter the country illegally, without proper documentation, are called unauthorized immigrants. The main pull factor for migrants to enter illegally is for economic reasons.
The Pew Research Center believes that as of 2013, roughly 11.3 million unauthorized immigrants currently live in the United States. The Center also determined that California and Texas have the fastest growing unauthorized immigrants. The majority of them originate from Mexico, followed by Latin America. Of the 11.3 million unauthorized immigrants, roughly 1 million are children.
Unauthorized immigrants have also given birth to roughly 4.5 million babies, which are legal U.S. citizens under current law. And finally, of the 11.3 million unauthorized immigrants, approximately 8 million are currently employed in the United States.
There are greater concerns in the United States and Europe regarding unauthorized immigration. In the United States, many Americans are growing concerned about border security. In December 2018 through January 2019, the U.S. federal government was shut down over a dispute between Congress and the President around funding the government and border security. Most Americans want stronger border security, but question how much to pay and what to invest in for that protection. Others have concerns about jobs being given to unauthorized immigrants, even though most of those jobs are not sought after by most Americans.
Interestingly enough, unauthorized immigration is controversial in Mexico as well. Most of the immigration from Mexico comes from the north of the country. But immigration from Mexico’s southern border comes from Latin American countries such as Guatemala. The people of southern Mexico are unsure of immigration from their southern border for many of the same reasons as the United States.
In Europe, immigrants come from poorer regions from the south looking for economic opportunities. Poorer countries favor allowing their citizens to migrate to Europe as a way to take stress off their low employment. Immigrants who migrate to Europe also send remittances back to their places of origin. As a way to accommodate and benefit from these migrants, many European countries use to have guest worker programs. Typically, guest workers come from developing countries and are allowed to stay and work legally, temporarily. Circular migration occurs when a migrant temporarily moves to a country to work, returns home, but returns again when work is needed again. But today in Europe, most guest worker programs have been dissolved.
Attitudes of immigrants in Europe and the United States have eroded over the years. Many blame immigrants for crime, unemployment, and stress on their social safety net and welfare programs. Ultimately, anti-immigration groups fear that immigrants will interfere with cultural traditions as migrants bring different religions, languages, foods, and habits with them. These tensions are fueling extremist groups and a recent resurgence in nationalism, racism, and bigotry in Europe and the United States.
U.S. QUOTA LAWS
United States created the Quota Act in 1921 and the National Origins Act in 1924, as a way to curb unrestricted immigration. These laws created a quota, a maximum limit on the number of people allowed to migrate to the United States every year. Because more migrants want to relocate to the United States than the country will allow in, the country has created the following priorities:
- Roughly three-fourths of legal immigration into the United States is for family reunification.
- Migrants who offer specific economic, scientific, or technological skill sets are the second largest group allowed to migrate into the country.
- Finally, a small portion of migrants is allowed into the country through a lottery system to increase diversity from countries who have historically sent few people to the United States.
The quota system for the United States does not include refugees. Some countries have stated that because the United States allows migrants who offer important or skilled work to enter the country legally, it leads to a brain drain from the countries these migrants come from. Another aspect of immigration in the United States deals with chain migration. When skilled workers are allowed to migrate to the United States, they have the ability to bring family members into the country legally, called chain migration.
