
|
A Multiple Regression Analysis of Health Care Access in Least Developed Countries Angel Bentsil, Howard Community College Mentored by: Allison Bell |
Abstract
Availability and accessibility to health care are vital to every person’s existence, no matter where they live in the world. This research aims to analyze the number of physicians in comparison to different socioeconomic variables for 45 of the world’s Least Developed Countries (LDC), according to the United Nations Department of Economic and Social Affairs. An LDC is determined by the gross national income of a country, the human asset index, and the economic and environmental vulnerability of a country. [1] The desire of this study is to eventually determine if the data will show how accessible health care is to adults and children in these countries. The data in this research was gathered from the World Health Organization, United Nations, World Bank, and Central Intelligence Agency on several factors in each country including average income per year, median age, number of hospital beds per thousand, neonatal mortality rate, average years of education, and life expectancy from birth. Using multiple and linear regression, this data will be charted and analyzed to determine if any trends exist between the number of physicians and the factors listed above. The expectation is to discover correlations between some of these factors and the number of physicians and eventually include pediatric factors in this observational study, by using specific categories in relation to children.
Introduction
Healthcare is an essential component for the survival of humans on our planet, so the topic of healthcare will be relevant for as long as humanity exists. As medicine has improved over the centuries, people have become more aware and attentive to various aspects of their health, with a keen consideration for their mental, social, and physical well-being, along with the well-being of others. World leaders have also recognized the importance of this. The United Nations General Assembly recently adopted Goal 3, “ensure healthy lives and promote well- being for all at all ages”, as one of the Sustainable Development Goals for 2030 [2].
Least Developed Countries, or LDCs, are an official categorization of 45 low-income countries across the globe. According to the United Nations, these nations are characterized by significant structural impediments to long-term sustainable development and are highly prone to economic and environmental shock [1]. In addition to this, LDCs have a low human asset index value, a composite indicator of health and education [3]. Every three years, the UN Committee for Development Policy reviews the current list of LDCs to make suggestions to the Economic and Social Council to determine if countries should be graduated or added to the list [1].
This research is unique in that it aims to study healthcare access in least developed countries to determine the relationship between the access and a unique combination of independent variables, using data from existing data sources.
Literature Analysis
It is not unknown for simple linear regression and multiple linear regression to be utilized in measuring relationships and discovering correlations in the world of health care. Multiple regression analysis has been used to analyze the relationships of various healthcare-related topics including the effectiveness of machine learning and artificial intelligence [4], the receptiveness of palliative care in a specific country [5], and behavior disorders among adolescents [6]. Most multiple analysis studies on developing countries are usually case studies in which surveys are conducted and data is collected from the questionnaires developed for this purpose. Analyses are then conducted to ascertain any relationships that exist based on feedback.
Research done on healthcare access in developing countries is limited compared to the information present in more developed countries. Information and data, especially related to health care in these countries, are difficult to locate due to the lengthy survey cycles, inferior survey instruments, and data gaps. [7] Nevertheless, this does not diminish the significance of the information gathered from these countries; studies have been done on LDCs that have investigated various health-related subjects. Due to a lack of funding and increasing expenses, as well as logistical difficulties, many healthcare facilities in these developing countries struggle to meet adequate water, hygiene, sanitation, and waste management standards presented by the World Health Organization (WHO) [8]. This has many negative effects on the health of the community, as these deficiencies hinder the ability of healthcare professionals to properly care for patients and respond to health crises [9]. These factors, among others like high population densities, contribute to the lack of professional care accessible to individuals in these countries [9]. Besides working in poor conditions, healthcare professionals in these settings are prone to exhaustion, high loads of stress, and lack of motivation resulting from low wages, intense workloads, and increased risk of contracting infections, like hepatitis and the human immunodeficiency virus [10]. Furthermore, hospital units for patients in need of critical care are mostly located in urban areas, making it difficult for critical patients in rural areas to access the help they need [11]. Researchers have also highlighted the large economic burden healthcare expenses are on low-income citizens, especially in urbanized and metropolitan areas [12]. These factors help to explain and shed more light on the issues causing the inaccessible nature of healthcare in LDCs.
Methodology
Multiple and linear regression are used to determine the accessibility to health care in these countries. Simple linear regression analyzes the relationship between a single independent and dependent variable, while multiple regression studies the relationship between a single dependent variable and many independent variables [13].
To do this, scatterplots of each independent variable and the dependent variable were compared. Scatterplots graph an independent variable on the x-axis and the dependent variable on the y-axis. From here, a correlation coefficient was calculated for each scatterplot, which determines the measure of the strength of the linear relationship between the two variables (Figure 1). If it was determined that the correlation coefficient displayed a strong enough relationship to be a predictor, then a linear regression model was found. A linear regression model provides the best possible linear representation of data while focusing on reducing the residuals in the data set. Residuals are the difference between the observed data (data recorded by researchers) and the expected data (data calculated using the regression model) [13].
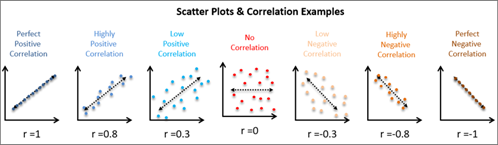
Figure 1: This image demonstrates the various linear regression scatterplots with the regression line and correlation coefficients [21].
Once strong relationships were established between several independent variables and our dependent variable, a multiple regression analysis was performed. Multiple linear regression, similar to simple linear regression performed earlier in the process, attempts to find multiple predictor variables to explain one dependent variable. The goal of this study is to see how well several independent variables led to predicting our dependent variable.
Finding and Results
The results of a multiple linear regression were analyzed by looking at several features of the regression output. First, we are provided with a multiple regression equation, or an equation that uses each of the independent variables to predict the dependent variable (i.e. has several input values). Next, we analyze the test statistic and p-value provided by the multiple regression calculations. A test statistic informs us as to whether the slope of the line using each independent variable differs from 0. Each test statistic (t-stat) has a p-value associated with it. The p-value is the probability of seeing a slope higher than that obtained with research, given the slope of the line was 0. This means that, if we get a small p-value (less than 0.05), we will conclude a strong relationship between that independent variable and the dependent variable in question. (Figure 3, pg. 5)
For this multiple and linear regression analysis, the number of physicians per 1000 individuals, as presented by the World Bank, was chosen as a representation of healthcare access [14]. This dependent variable was selected because of the limited availability of the data on other fully encapsulating healthcare access variables. At the onset of this research project, the plan was to use the number of pediatricians and the number of healthcare facilities in each of these countries, but this proposition had to change due to the lack of sufficient data from each LDC.
Our fourteen independent variables were selected among various health-related and socioeconomic factors from available and recent datasets. Some of these variables included the number of hospital beds per 1000 people, neonatal mortality rate, population increase rate, median age, annual number of births, etc. We chose these variables based on our expectation of a strong correlation between the variable(s) and the number of physicians present in each country. Next, the data was collected and organized into an Excel spreadsheet from various credible data sources, including the United Nations, the World Health Organization, the Central Intelligence Agency, and the World Bank. To collect the data for each variable, a systematic process was adopted to go through all the information for each of the countries given on the datasheet, and a selection was made of the figures needed for the analysis.
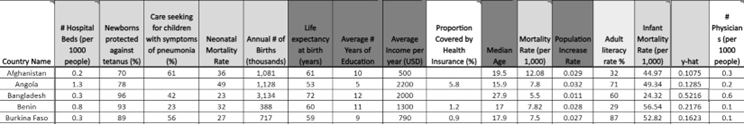
Table 1: This is a snapshot of 5 rows of the datasheet for the data from various sources including the United Nations, the World Health Organization, the Central Intelligence Agency, and the World Bank. The entire spreadsheet can be found in Appendix A.
After the majority of data was collected, we used the Charts function of Excel to generate scatter plots, with the dependent variable, the number of physicians per 1000 individuals, on the y-axis, and the independent variable on the x-axis. Each point on the graph represented one country. In creating the scatterplots, the correlation coefficient and line of best fit were also generated. This helped in the discovery of the strength and direction of the relationship; for instance, whether a variable had a low positive correlation, a moderate negative correlation, or no correlation at all. To perform the multiple regression analysis, the Data Analysis Tool Pack, a download Excel addon feature, was downloaded and used.
Once the simple linear regression scatter plots were created for all fourteen variables (three of which are shown below in Figure 2), the independent variables with the strongest correlation coefficient were then chosen to be used for the multiple regression analysis. The correlation coefficients for these variables were around r = ±0.4-0.5, with the largest being r = 0.5718.
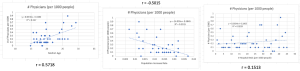
Figure 2: These are images of some of the scatterplots generated in the simple linear regression; the correlation coefficient indicates the direction and strength of the relationship between the dependent variable (y-axis) and independent variable (x-axis).
The variables with the strongest correlations included the life expectancy at birth (years) [15], average number of years of education [16], average income per year (USD) [17], median age [18], population increase rate [19], and adult literacy rate [20].
From the multiple regression results, it can be concluded that average years of education [16], average income per year (USD) [17], and adult literacy [20] are the strongest predictors.
Overall, the r-value for the multiple regression is 0.69925341 and the significance is 0.000161. This r-value is closer to 1 than 0, indicating that there is strength in this linear relationship between the many predictor variables and the dependent variable. Significance below 0.05 indicates that the slope of the regression line relating these variables is not 0, which also indicates a relationship that exists between the predictors and dependent variable.
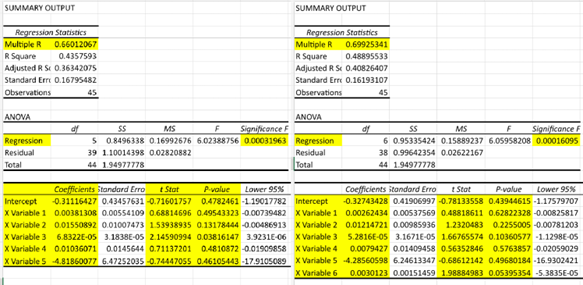
Figure 3: These are images of the multiple regression results which include the R-value, t-stat, p-value, and significance. The results on the left show the analysis with only 5 variables (before adult literacy), while the results on the right show the analysis with 6 variables (adult literacy included).
Using the multiple regression generated model (1), the y-hat value, or predicted number of doctors for each country can be determined using the strong independent variables: life expectancy at birth (x1) [15], average number of years of education (x2) [16], average income per year (x3) [17], median age (x4) [18], population increase rate (x5) [19], and adult literacy rate (x6) [20].
𝑦” = – 0.32743428 + 0.00262434 𝑥! + 0.01214721𝑥” + 0.000052816𝑥# + 0.0079427𝑥$ − 4.28560598𝑥% + 0.0030123𝑥& (1)
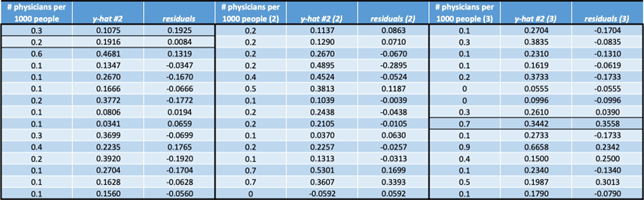
Table 2: This table contains the y-hat values next to the actual data. The residual is the difference between the y-hat value generated from multiple regression model and the actual data.
Discussion
The results demonstrate a correlation between the strong independent variables and the dependent variable, with variables x2, x3, and x6 (average years of education, average income per year (USD), and adult literacy respectively) being the strongest predictors because of their relatively low p-value (Figure 3). We can come to the conclusion of why this is by assuming that in areas where inidividuals are more educated and have higher incomes, there should be more physicians. When the p-value is low, it indicates a low probability of getting results that are more extreme than the sample data. The r-value for the multiple regression analysis was larger than any of the r-values for the simple linear regression analyses, suggesting that when studied as a group, the strong independent variables have a stronger relationship to the dependent variable than the independent variables on their own.
It was surprising to discover more than half of the variables we had hypothesized to have a strong relationship to the dependent variable had a weak or no correlation (r = ±0 – 0.3). Some of these variables included variables like the number of hospital beds per 1000 people, the percentage of children seeking care with symptoms of pneumonia, the percentage of newborns protected against tetanus, etc. This may support some of the conclusions in previous research stated earlier that doctors and healthcare workers are understaffed in many areas due to the intense workload present, insufficient support, and exposure to various diseases [9][10].
During the data collection process, some adjustments had to be made to the independent variable list owing to the lack of data on some of the LDCs. For instance, when collecting data on the proportion of the population covered by health insurance, it was observed that there were numerous holes in the data. This may have rendered this variable as non-beneficial to the study, considering the goal was to collect information on all 45 developing countries. Throughout the whole collection process, there was a struggle to find data that was relevant and current, as most of the information that was recovered was either obsolete or irrelevant to the study; this may have affected the outcome of the analysis.
One of the adjustments made to the original list of the independent variables was the addition of the adult literacy rate, which was added after the initial multiple regression analysis was completed. The adult literacy rate had the strongest correlation among the list of variables, and when added to the multiple regression variables, it altered the results by increasing the r- value and decreasing the significance (Figure 3). The potential reasoning behind this change is in the definition of LDCs; one of the contributing factors to a country’s nomination to become an LDC is a relatively low ranking on the human asset index, which measures health and education. Given that education has a significant role in LDC nomination [1] and that prior research has highlighted the deficit of healthcare workers and physicians in developing countries [9], it stands to reason that the adult literacy rate has a significant impact on the analysis findings. This reasoning could also be extended to other determining factors of LDCs, like average years of education and average income.
To test the effectiveness of a linear model, one can use the model to predict dependent data values and compare those predictions to real-life data. Once both multiple regressions were complete (one with literacy rate, and one without), differences between the predicted data from each regression line were assessed (Table 2). These differences between observed and predicted data are referred to as residuals. Interestingly, when both multiple regression equations were compared, the residuals were smaller when analyzing the regression equation that included adult literacy as one of the predictor variables. This is directly related to the increased strength in correlation found when adding adult literacy as a predictor. This added reinforcement that adult literacy was one of the strongest predictors of the number of physicians.
Conclusion
All people, including those in developing and low-income countries, are united by their shared need for access to healthcare and medicine. By using statistical analyses, this study has discovered various socioeconomic factors that correlate to healthcare access, represented by the number of physicians per 1000 people, in each of the LDCs. In addition to this, the strong predictors of healthcare access have been identified as the adult literacy rate, the average years of education, and average income. Further research can be conducted to discover stronger independent variables that correlate with the dependent variable, as this study was not exhaustive. Additional analysis can be done to determine if the variables with a strong relationship to healthcare access in developing countries will yield the same results for more developed countries.
Acknowledgements
I would like to express my sincere gratitude to my mentor and statistics professor Allison Bell, for her guidance and genuine enthusiasm throughout this entire research project. I am also thankful to Dr. Cheryl Campo, Honors Director at Howard Community College for her support and all her help. Finally, I would like to thank my family for encouraging and cheering me on through it all; Thank you Lord.
Contacts: angel.bentsil@howardcc.edu, aebentsil@gmail.com
References
[1] United Nations Committee for Development Policy, “Report on the twenty-fifth session,” Feb. 2023. Accessed: Feb. 23, 2024. [Online]. Available: https://undocs.org/Home/Mobile?FinalSymbol=E%2F2023%2F33&Language=E&DeviceT ype=Desktop&LangRequested=False
[2] United Nations General Assembly Economic and Social Council, “Sustainable development Agenda items 5 (a) and 6 High-level segment: ministerial meeting of the high-level political forum on sustainable development, convened under the auspices of the Economic and Social Council High-level political forum on sustainable development, convened under the auspices of the Economic and Social Council Progress towards the Sustainable Development Goals: towards a rescue plan for people and planet Report of the Secretary- General (special edition) Summary,” 2023. Accessed: Feb. 2023. [Online]. Available: https://unstats.un.org/sdgs/files/report/2023/secretary-general-sdg-report-2023–EN.pdf
[3] Feindouno Sosso and M. Goujon, “Human Assets Index retrospective series: 2016 update,” RePEc: Research Papers in Economics, Dec. 2016, Accessed: Feb. 2024. [Online]. Available: https://ferdi.fr/dl/df-j8Xb3gamq6g2dPcnuf4NdnAE/ferdi-p179-human-assets- index-retrospective-series-2016-update.pdf
[4] M. K. Devi et al., “Design and Implementation of Advanced Machine Learning Management and Its Impact on Better Healthcare Services: A Multiple Regression Analysis Approach (MRAA),” Computational and Mathematical Methods in Medicine, vol. 2022, pp. 1–7, Apr. 2022, doi: https://doi.org/10.1155/2022/2489116.
[5] Su Lin Yeo et al., “Public sentiments and the influence of information-seeking preferences on knowledge, attitudes, death conversation, and receptiveness toward palliative care: results from a nationwide survey in Singapore,” Palliative care and social practice, vol. 17, Jan. 2023, doi: https://doi.org/10.1177/26323524231196311.
[6] B. J. Leadbeater, G. J. Merrin, A. Contreras, and M. E. Ames, “Trajectories of oppositional defiant disorder severity from adolescence to young adulthood and substance use, mental health, and behavioral problems.,” PubMed, vol. 32, no. 4, pp. 224–235, Nov. 2023, Accessed: Feb. 2024. [Online]. Available: https://pubmed.ncbi.nlm.nih.gov/38034412/
[7] L. Zhao et al., “Data gaps towards health development goals, 47 low- and middle-income countries,” Bulletin of the World Health Organization, vol. 100, no. 1, pp. 40–49, Jan. 2022, doi: https://doi.org/10.2471/blt.21.286254.
[8] M. Chaitkin et al., “Estimating the cost of achieving basic water, sanitation, hygiene, and waste management services in public health-care facilities in the 46 UN designated least- developed countries: a modelling study,” The Lancet Global Health, vol. 10, no. 6, pp. e840–e849, Jun. 2022, doi: https://doi.org/10.1016/s2214-109x(22)00099-7.
[9] M. Al-Shamsi, “Addressing the physicians’ shortage in developing countries by accelerating and reforming the medical education: Is it possible?,” Journal of Advances in Medical Education and Professionalism, vol. 5, no. 4, pp. 209–212, Oct. 2017, Accessed: Feb. 23, 2024. [Online]. Available: https://doaj.org/article/c308b3171a8c4aac81f13424be726691
[10] M. W. Dünser, I. Baelani, and L. Ganbold, “A review and analysis of intensive care medicine in the least developed countries*,” Critical Care Medicine, vol. 34, no. 4, pp. 1234–1242, Apr. 2006, doi: https://doi.org/10.1097/01.ccm.0000208360.70835.87.
[11] N. T. de Siqueira Filha et al., “The economics of healthcare access: a scoping review on the economic impact of healthcare access for vulnerable urban populations in low- and middle- income countries,” International Journal for Equity in Health, vol. 21, no. 1, Dec. 2022, doi: https://doi.org/10.1186/s12939-022-01804-3.
[12] K. Stenberg et al., “Financing transformative health systems towards achievement of the health Sustainable Development Goals: a model for projected resource needs in 67 low- income and middle-income countries,” The Lancet Global Health, vol. 5, no. 9, pp. e875– e887, Sep. 2017, doi: https://doi.org/10.1016/s2214-109x(17)30263-2.
[13] W. Navidi and B. Monk, Elementary statistics. New York, Ny: Mcgraw-Hill, 2013.
[14] “World Bank Open Data,” World Bank Open Data. https://data.worldbank.org/indicator/SH.MED.PHYS.ZS?locations=XL (accessed Mar. 15, 2023).
[15] “Life expectancy at birth, total (years) – Least developed countries: UN classification | Data,” data.worldbank.org. https://data.worldbank.org/indicator/SP.DYN.LE00.IN?locations=XL (accessed Mar. 14, 2023).
[16] CIA, “School life expectancy (primary to tertiary education) – The World Factbook,” www.cia.gov. https://www.cia.gov/the-world-factbook/field/school-life-expectancy- primary-to-tertiary-education/ (accessed Mar. 14, 2023).
[17] The World Bank, “The World by Income and Region,” datatopics.worldbank.org, 2023. https://datatopics.worldbank.org/world-development-indicators/the-world-by-income-and- region.html (accessed Mar. 15, 2023).
[18] CIA, “Median age – The World Factbook,” www.cia.gov. https://www.cia.gov/the-world- factbook/field/median-age/ (accessed Mar. 14, 2023).
[19] CIA, “Population growth rate – The World Factbook,” www.cia.gov. https://www.cia.gov/the-world-factbook/field/population-growth-rate/country-comparison/
[20] The World Bank, “Literacy rate, adult total (% of people ages 15 and above) | Data,” Worldbank.org, 2021. https://data.worldbank.org/indicator/SE.ADT.LITR.ZS (accessed Apr. 02, 2023).
[21] Scatter Plots & Correlation Examples. 2023. Accessed: Apr. 25, 2023. [Online]. Available: https://cqeacademy.com/cqe-body-of-knowledge/continuous-improvement/quality-control- tools/the-scatter-plot-linear-regression/
Appendix A
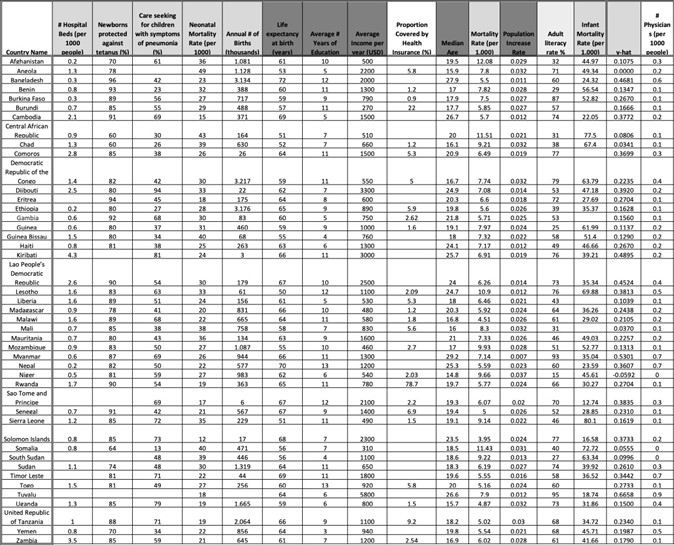
Appendix A: This is the full datasheet of the data collected from various sources including the United Nations, the World Health Organization, the Central Intelligence Agency, and the World Bank.