
6 Chapter 6 Global Climate Change for print only
6.1 Climate Change in Earth History
For the past two centuries, the climate has been relatively stable. People placed their farms and cities in locations that were in a favorable climate without thinking that the climate could change. However, the climate has changed throughout Earth history, and a stable climate is not the norm. In recent years, Earth’s climate has begun to change again. Most of this change is warming because of human activities that release greenhouse gases into the atmosphere. The effects of warming are already being seen and will become more extreme as temperature rise.
Climate has changed throughout Earth history. Much of the time Earth’s climate was hotter and more humid than it is today, but climate has also been colder, as when glaciers covered much more of the planet. The most recent ice ages were in the Pleistocene Epoch, between 1.8 million and 10,000 years ago. Glaciers advanced and retreated in cycles, known as glacial and interglacial periods. With so much of the world’s water bound into the ice, sea level was about 125 meters (395 feet) lower than it is today. Many scientists think that we are now in a warm, interglacial period that has lasted about 10,000 years.
For the past 2,000 years, the climate has been relatively mild and stable when compared with much of Earth’s history. Why has climate stability been beneficial for human civilization? Stability has allowed the expansion of agriculture and the development of towns and cities.
Relatively small temperature changes can have significant effects on the global climate. The average global temperature during glacial periods was only about 5.5 degrees C (10 degrees F) less than Earth’s current average temperature. Temperatures during the interglacial periods were about 1.1 degrees C (2 degrees F) higher than today.
Since the end of the Pleistocene, the global average temperature has risen about 4 degrees C (7 degrees F). Glaciers are retreating, and sea level is rising. While climate is getting steadily warmer, there have been a few more extreme warm and cool times in the last 10,000 years. Changes in climate have had effects on human civilization. The Medieval Warm Period from 900 to 1300 A.D. allowed Vikings to colonize Greenland and Great Britain to grow wine grapes. The Little Ice Age, from the 14th to 19th centuries, the Vikings were forced out of Greenland and humans had to plant crops further south.
6.2 Short-Term Climate Changes
Short-term changes in climate are common, with the largest and most important of these is the oscillation between El Niño and La Niña conditions. This cycle is called the El Niño Southern Oscillation (ENSO). The ENSO drives changes in climate that are felt around the world about every two to seven years.
In a typical year, the trade winds blow across the Pacific Ocean near the equator from east to west (toward Asia). A low-pressure cell rises above the western equatorial Pacific. Warm water in the western Pacific Ocean and raises sea levels by a one-half meter. Along the western coast of South America, the Peru Current carries cold water northward, and then westward along the equator with the trade winds. Upwelling brings cold, nutrient-rich waters from the deep sea.
In an El Niño year, when water temperature reaches around 28 degrees C (82 degrees F), the trade winds weaken or reverse direction and blow east (toward South America). Warm water is dragged back across the Pacific Ocean and piles up off the west coast of South America. With warm, low-density water at the surface, upwelling stops. Without upwelling, nutrients are scarce, and plankton populations decline. Since plankton forms the base of the food web, fish cannot find food, and fish numbers decrease as well. All the animals that eat fish, including birds and humans, are affected by the decline in fish.
By altering atmospheric and oceanic circulation, El Niño events change global climate patterns. Some regions receive more than average rainfall, including the west coast of North and South America, the southern United States, and Western Europe. Drought occurs in other parts of South America, the western Pacific, southern and northern Africa, and southern Europe.
An El Niño cycle lasts only a few years, with normal circulation patterns resuming. Sometimes circulation patterns bounce back quickly and remarkably, called La Niña. During a La Niña year, as in a typical year, trade winds move from east to west and warm water piles up in the western Pacific Ocean. Ocean temperatures along coastal South America are colder than average (instead of warmer, as in El Niño). Cold water reaches farther into the western Pacific than usual.
Other significant oscillations are smaller and have a local, rather than global, effect. The North Atlantic Oscillation mostly alters the climate in Europe. The Mediterranean also goes through cycles, varying between being dry at some times, and warm and wet at others.
6.3 Causes of Long-Term Climate Change
In order to have an intelligent conversation about the current warming of the planet, one must have a strong understanding of the natural causes, processes, and cycles of naturally occurring climate change. These natural processes and cycles are imputed into extremely complex climate models to analyze past, present, and future climate trends and patterns.
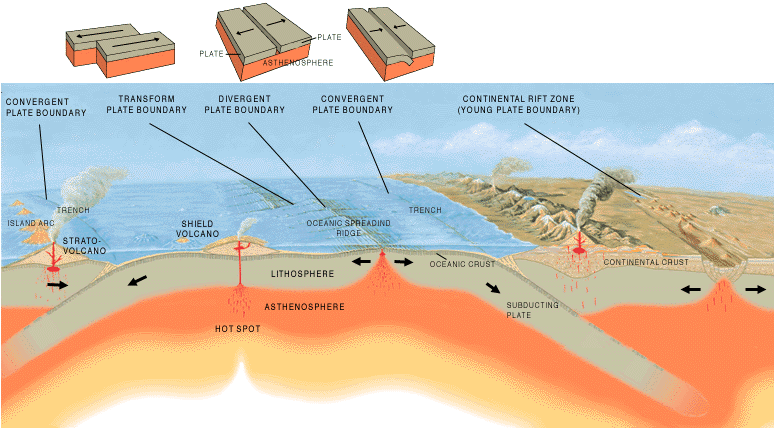
PLATE TECTONICS
As noted in the chapter on Plate Tectonics, tectonic plates are moving around the earth’s surface because of convection within the mantle. This is the driving force of mountain building, earthquakes, and volcanoes around the planet. But the movement of tectonic plates can also alter regional and global climates. Over millions of years as seas open and close, ocean currents may distribute heat differently across the planet. For example, when all the continents are joined into one supercontinent (such as Pangaea), nearly all location experience a continental climate. When the continents separate, heat is more evenly distributed.

Plate tectonic movements may help start an ice age. When continents are located near the poles, ice can accumulate, which may increase albedo and lower global temperature. Low enough temperatures may start a global ice age. A recent scientific study by scientists at MIT in 2019, titled Arc-continent collisions in the tropics set Earth’s climate state, suggests that the last three major ice ages occurred because of plate tectonic activity near the equator.
Tectonic plate motions can trigger volcanic eruptions, which release dust and carbon dioxide into the atmosphere. Ordinary eruptions, even large ones, have only a short-term effect on weather. Massive eruptions of the fluid lavas that create lava plateaus release much more gas and dust and can change the climate for many years. This type of eruption is exceedingly rare; none has occurred since humans have lived on Earth.
MILANKOVITCH CYCLES
The most extreme climate of recent Earth history was the Pleistocene. Scientists attribute a series of ice ages to variation in the Earth’s position relative to the Sun, known as Milankovitch cycles. The Earth goes through regular variations in its position relative to the Sun:
The shape of the Earth’s orbit changes slightly as it goes around the Sun, called eccentricity. The orbit varies from more circular to more elliptical in a cycle lasting between 90,000 and 100,000 years. When the orbit is more elliptical, there is a more significant difference in solar radiation between winter and summer.


The Earth wobbles on its axis of rotation, called precession. At one extreme of this 27,000-year cycle, the Northern Hemisphere points toward the Sun when the Earth is closest to the Sun. Summers are much warmer, and winters are much colder than now. At the opposite extreme, the Northern Hemisphere points toward the Sun when it is farthest from the Sun, resulting in cool summers and warmer winters.

The planet’s tilt on its axis varies between 22.1 degrees and 24.5 degrees, called obliquity. Seasons are caused by the tilt of Earth’s axis of rotation, which is at a 23.5o angle now. When the tilt angle is smaller, summers and winters differ less in temperature. This cycle lasts 41,000 years.

When these three variations are charted out, a climate pattern of about 100,000 years emerges. Ice ages correspond closely with Milankovitch cycles. Since glaciers can form only over land, ice ages only occur when landmasses cover the polar regions. Therefore, Milankovitch cycles are also connected to plate tectonics.
SUN VARIATION
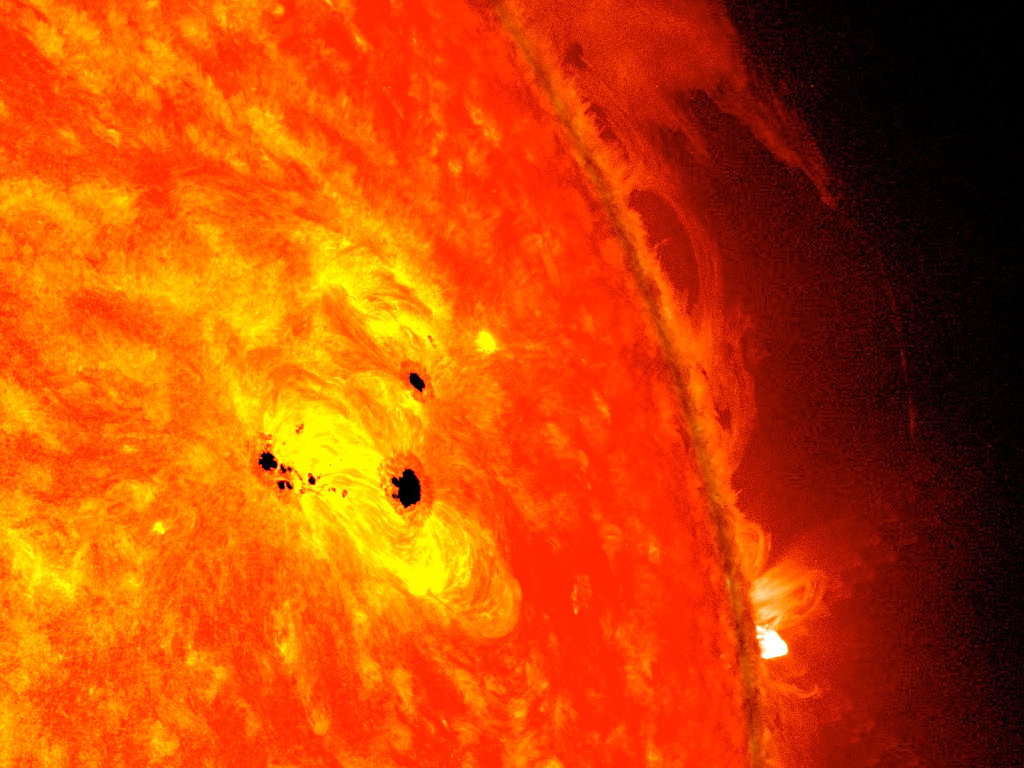
The amount of energy the Sun radiates is relatively constant over geologic time, but slightly fluctuates over the decades. Part of this fluctuation occurs because of sunspots, magnetic storms on the Sun’s surface that increase and decrease over an 11-year cycle.
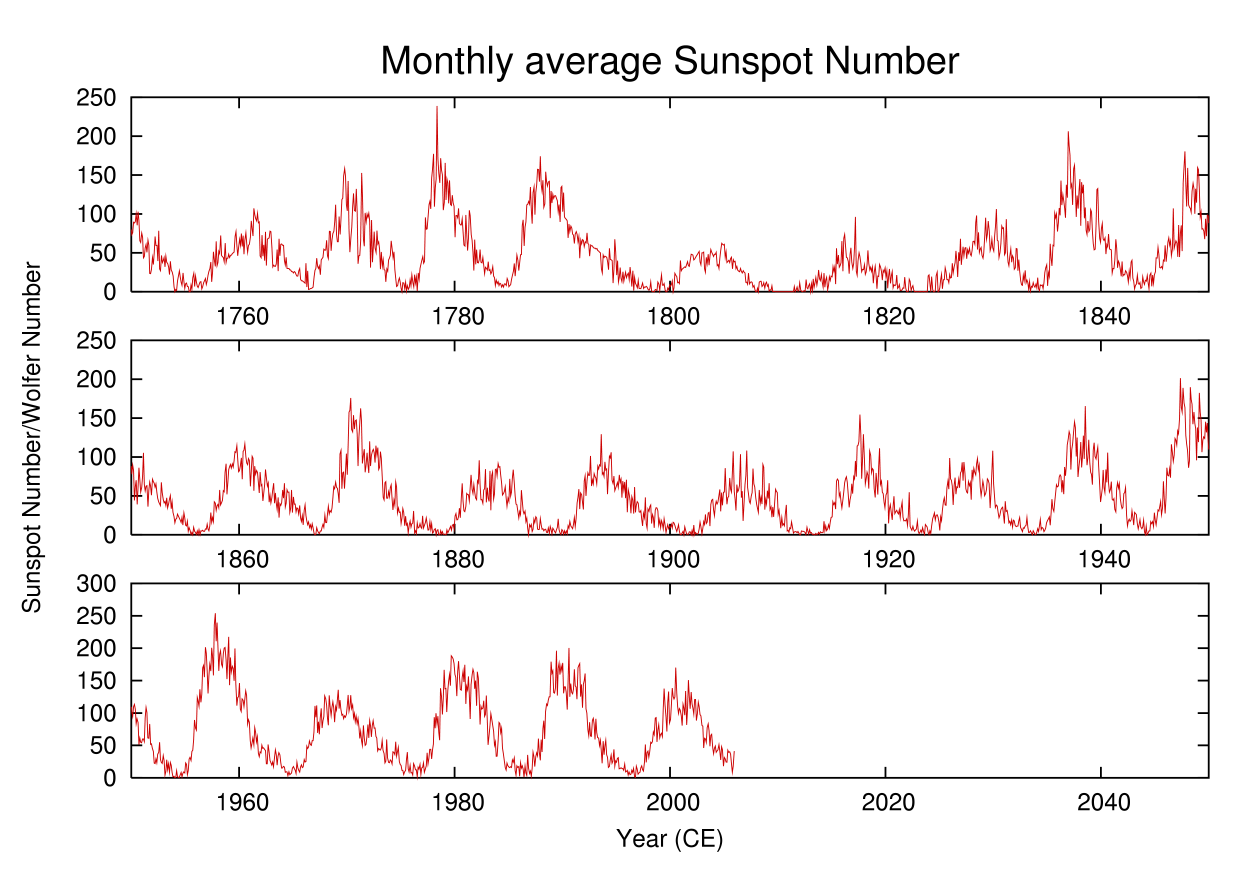
When the number of sunspots is high, solar radiation is also relatively high. However, the entire variation in solar radiation is tiny relative to the total amount of solar radiation that there is an 11-year cycle in climate variability. The Little Ice Age corresponded to a time when there were no sunspots on the Sun.
CHANGES IN ATMOSPHERIC GREENHOUSE GAS LEVELS
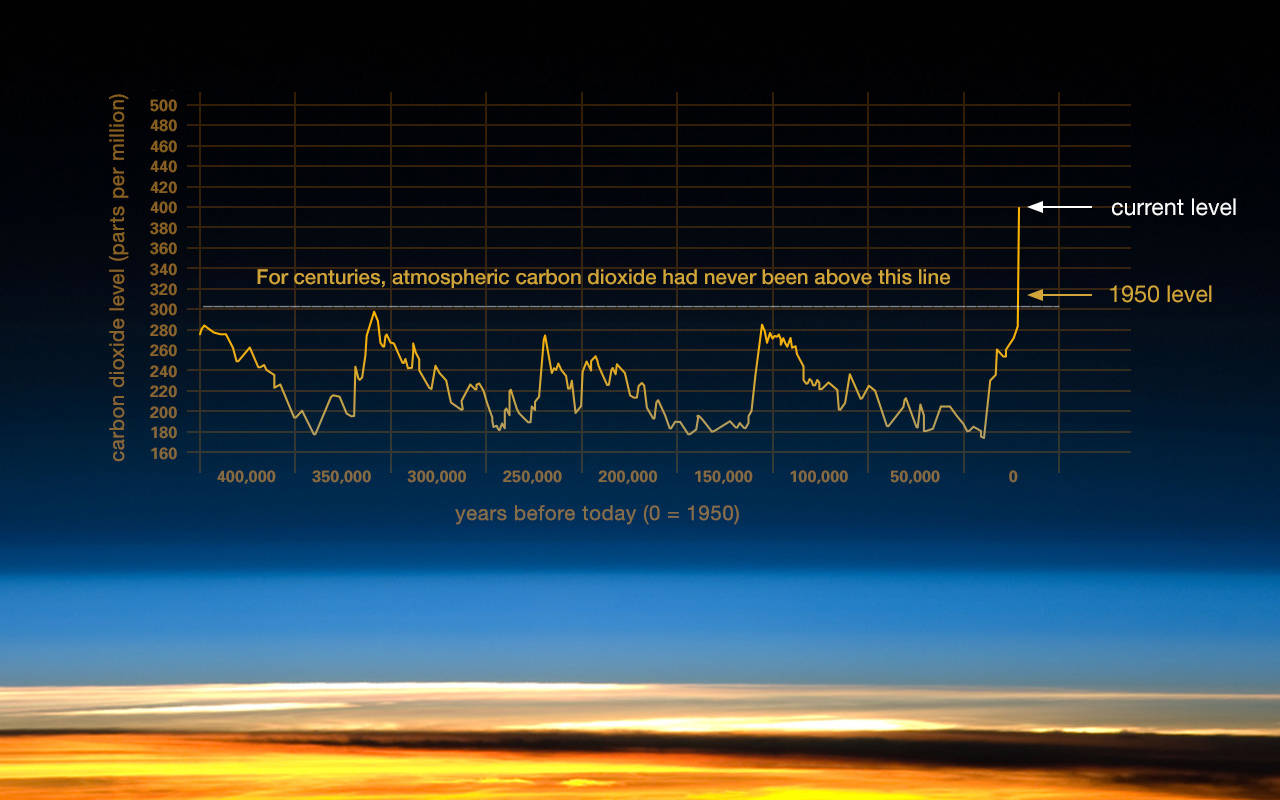
Climatic data from ice core drillings, rings within coral reefs and trees, ocean and lake sediments, and other sources indicate that when greenhouse gasses increase in the atmosphere, global temperatures rise. When greenhouse gasses decrease in the atmosphere, global temperatures fall. In 1958, the National Oceanic and Atmospheric Administration (NOAA) began measuring carbon dioxide levels in real time. What direct measurements of carbon dioxide in the atmosphere indicate is that every year, the concentration of the gas increases globally every six months and decreases six months later. This has mostly to do with the continents in the northern hemisphere, where the majority of the continents and trees are located. During the warmer months, the trees in the northern hemisphere begin photosynthesizing by taking carbon dioxide out of the atmosphere and use sunlight to create chlorophyll. This causes global greenhouse gases to decrease for six months. When the northern hemisphere experiences fall and winter, the trees stop photosynthesizing and become dormant, causing global greenhouse gases to increase. However, even though carbon dioxide levels increase and decrease every year, the global trend is that carbon dioxide levels are growing every year. Current measurements from NASA indicate that carbon dioxide levels are at 411 ppm, the highest the earth has seen in nearly a million years.

Recently, NASA has created ultra-high-resolution computer models, giving scientists a stunning new look at how carbon dioxide in the atmosphere travels around the globe.
Greenhouse gas levels have varied throughout Earth history. For example, carbon dioxide has been present at concentrations less than 200 parts per million (ppm) and more than 5,000 ppm. However, for at least 650,000 years, carbon dioxide has never risen above 300 ppm, during either glacial or interglacial periods. Natural processes add (volcanic eruptions and the decay or burning of organic matter) and remove absorption by plants, animal tissue, and the ocean) carbon dioxide from the atmosphere. When plants are turned into fossil fuels, the carbon dioxide in their tissue is stored with them. So carbon dioxide is removed from the atmosphere.
Fossil fuel use has skyrocketed in the past few decades more people want more cars and industrial products, releasing vast quantities of carbon dioxide into the atmosphere. Burning tropical rainforests, to clear land for agriculture, a practice called slash-and-burn agriculture, also increases atmospheric carbon dioxide. By cutting down trees, they can no longer remove carbon dioxide from the atmosphere. Burning the trees releases all the carbon dioxide stored in the trees into the atmosphere.
There is now nearly 40 percent more carbon dioxide in the atmosphere than there was 200 years ago, before the Industrial Revolution. About 65 percent of that increase has occurred since the first carbon dioxide measurements were made on Mauna Loa Volcano, Hawaii, in 1958. Carbon dioxide is the most important greenhouse gas that human activities affect because it is so abundant. However, other greenhouse gases are increasing as well. The main greenhouse gases include:
- Water vapor (36-70 percent of total): is the most abundant and powerful greenhouse gas on the planet and is part of the hydrologic cycle.
- Carbon dioxide (9-26 percent of total): released from the burning of fossil fuels.
- Methane (4-9 percent of total): released from raising livestock, rice production, and the incomplete burning of rainforest plants.
- Tropospheric ozone (3-7 percent of total): from vehicle exhaust, it has more than doubled since 1976.
6.4 Anthropogenic Climate Change

The scientific consensus is clear, in that 97 percent of all scientists who directly study climates and climate change believe that the current warming of the planet is anthropogenic (human) in nature. And all of the scientific evidence and planetary vital signs indicate that more greenhouse gases are trapping Earth’s heat, causing average annual global temperatures to rise. While temperatures have risen since the end of the Pleistocene, 10,000 years ago, this rate of increase has been more rapid in the past century and has risen even faster since 1990. The nine warmest years on record have all occurred since 1998, and NASA and NOAA reported in 2019 that the year 2018 was the fourth warmest ever recorded on the planet. The 2010-2020 is predicted to be the warmest decade yet, followed by 2000-2010.
The United States has long been the largest emitter of greenhouse gases, with about 20 percent of total emissions. As a result of China’s rapid economic growth, its emissions surpassed those of the United States in 2008. However, it is also important to keep in mind that the United States has only about one-fifth the population of China. What is the significance of this? The average United States citizen produces far more greenhouse gases than the average Chinese person.
Predicted FUTURE WARMING
Climate change can be a naturally occurring process and has created environments much warmer than today, such as the early Cretaceous period. During this time, life thrived even in regions, such as the interior of Antarctica, that is uninhabitable today.
One misconception is that the threat of climate change has to do with the absolute warmth of the Earth. That is not, in fact, the case. It is, instead, the rate of change that has scientists concerned. Living things, including humans, can quickly adapt to substantial changes in climate as long as the changes take place slowly, over many thousands of years or longer. However, adapting to changes that are taking place on timescales of decades is far more challenging. But the planet is warming at such a rate that most species, especially mammals, will struggle to adapt and literally evolve quickly enough to the coming warmer climates.
Here is a useful “thought experiment” to illustrate what sort of discussion might be happening now if, instead of the current climate, we were living under the climate conditions of the last Ice Age, and human fossil fuel emissions were pushing us out of the ice age and into conditions resembling the pre-industrial period, rather than the actual case, where we are pushing the Earth out of the pre-industrial period and into a period with conditions more like the Cretaceous.
It turns out that the natural increase in atmospheric carbon dioxide that led to the thaw after the last Ice Age was an increase from 180 parts per million (ppm) to about 280 ppm. This was a smaller increase than the present-time increase due to human activities, such as fossil fuel burning, which thus far have raised CO2 levels from the pre-industrial value of 280 ppm to a current level of over 410 ppm – a level which is increasing by 2 ppm every year. So, arguably, if the dawn of industrialization had occurred 18,000 years ago, we may very likely have sent the climate from an ice age into the modern pre-industrial state.
How long it would have taken to melt all of the ice is not precisely known, but it is conceivable it could have happened over a period as short as two centuries. The area ultimately flooded would be considerably more significant than that currently projected to flood due to the human-caused elevation of carbon dioxide that has taken place so far. Below is a video from Science Insider on what the planet would like today if all the glaciers melted.
By some measures, human interference with the climate back then, had it been possible, would have been even more disruptive than the current interference with our climate. That interference would merely be raising global mean temperatures from those of the last Ice Age to those that prevailed in modern times before industrialization. What this thought experiment tells us is that the issue is not whether some particular climate is objectively “optimal.” The issue is that human civilization, natural ecosystems, and our environment are heavily adapted to a particular climate — in our case, the current climate. Rapid departures from that climate would likely exceed the adaptive capacity that we and other living things possess, and cause significant consequent disruption in our world.
The amount of carbon dioxide levels will continue to rise in the decades to come. However, the impacts will not be evenly distributed across the planet. Some of those impacts will depend on environmental and climate factors, other impacts will be dependent on whether the countries are developed or developing. Scientists use complex computer models to predict the effects of greenhouse gas increases on climate systems globally for specific regions of the world.
If nothing is done to control greenhouse gas emissions, and they continue to increase at current rates, the surface temperature of the Earth can be expected to increase between 0.5 degrees C and 2.0 degrees C (0.9 degrees F and 3.6 degrees F) by 2050 and between 2 degrees and 4.5 degrees C (3.5 degrees and 8 degrees F) by 2100, with carbon dioxide levels over 800 parts per million (ppm). On the other hand, if severe limits on carbon dioxide emissions begin soon, temperatures could rise less than 1.1 degrees C (2 degrees F) by 2100.
Whatever the temperature increase, it will not be uniform around the globe. A rise of 2.8 degrees C (5 degrees F) would result in 0.6 degrees to 1.2 degrees C (1 degree to 2 degrees F) at the equator, but up to 6.7 degrees C (12 degrees F) at the poles. So far, global warming has affected the North Pole more than the South Pole, but temperatures are still increasing at Antarctica.
Effects of Anthropogenic Climate Change
There are a variety of possible and likely effects of climate change on human and natural environments. NASA has tried to list some of those potential effects and can be found here. NASA also has a website called the Climate Time Machine, to help visualize Earth’s key climate indicators and how they are changing over time.
Human Impacts and Migration
Species Mating and Migration
The timing of events for species is changing. Mating and migrations take place earlier in the spring months, and species that are more mobile are migrating uphill. Some regions that were already marginal for agriculture are no longer farmable because they have become too warm or dry.
Melting Snowpacks and Glaciers
Decreased snow packs, shrinking glaciers, and the earlier arrival of spring will all lessen the amount of water available in some regions of the world, including the western United States and much of Asia. Ice will continue to melt, and sea level is predicted to rise 18 to 97 cm (7 to 38 inches) by 2100. An increase this large will gradually flood coastal regions where about one-third of the world’s population lives, forcing billions of people to move inland.
Glaciers are melting, and vegetation zones are moving uphill. If fossil fuel use exploded in the 1950s, why do these changes begin early in the animation? Does this mean that the climate change we are seeing is caused by natural processes and not by fossil fuel use?
Oceans and Rising Sea Levels
As greenhouse gases increase, changes will be more extreme. Oceans will become slightly more acidic, making it more difficult for creatures with carbonate shells to grow, and that includes coral reefs. A study monitoring ocean acidity in the Pacific Northwest found ocean acidity increasing ten times faster than expected and 10 percent to 20 percent of shellfish (mussels) being replaced by acid-tolerant algae.
Plant and animal species seeking cooler temperatures will need to move poleward 100 to 150 km (60 to 90 miles) or upward 150 m (500 feet) for each 1.0 degrees C (8 degrees F) rise in global temperature. There will be a tremendous loss of biodiversity because forest species cannot migrate that rapidly. Biologists have already documented the extinction of high-altitude species that have nowhere higher to go.
One may notice that the numerical predictions above contain wide ranges. Sea level, for example, is expected to rise somewhere between 18 and 97 centimeters by 2100. The reason for this uncertainty is in part because scientists cannot predict precisely how the Earth will respond to increased levels of greenhouses gases. How quickly greenhouse gases continue to build up in the atmosphere depends in part on the choices we make.
Extreme Weather
Weather will become more extreme with heat waves and droughts. Some modelers predict that the Midwestern United States will become too dry to support agriculture and that Canada will become the new breadbasket. In all, about 10% to 50% of current cropland worldwide may become unusable if CO2 doubles. There are global monitoring systems to help monitor potential droughts that could turn into famines if they occur in politically and socially unstable regions of the world and if appropriate action is not taken in time. One example is the Famine Early Warning System Network (FEWS NET), which is a network of social and environmental scientists using geospatial technology to monitor these situations. However, even with proper monitoring, if nations do not act, catastrophes can occur like in Somalia from 2010-2012.
Although scientists do not all agree, hurricanes are likely to become more severe and possibly more frequent. Tropical and subtropical insects will expand their ranges, resulting in the spread of tropical diseases such as malaria, encephalitis, yellow fever, and dengue fever.
An important question people ask is this: Are the increases in global temperature natural? In other words, can natural variations in temperature account for the increase in temperature that we see? The scientific data shows no, natural variations cannot explain the dramatic increase in global temperatures. Changes in the Sun’s irradiance, El Niño and La Niña cycles, natural changes in greenhouse gas, plate tectonics, and the Milankovitch Cycles cannot account for the increase in temperature that has already happened in the past decades.
In December 2013 and April 2014, the Intergovernmental Panel on Climate Change (IPCC) released a series of damaging reports on not only the current scientific knowledge of climate change but also on the vulnerability and impacts to humans and ecosystems. Below are two videos detailing the physical science of climate change and the risks and impacts to the planet.
6.5 Changing the Climate Change Narrative
However, it is essential to get a data-driven understanding of climate change. Along with the IPCC, other organizations like the United Nations Environmental Programme (UNEP), World Health Organizations, World Meteorological Organization (WMO), National Aeronautics and Space Administration (NASA), the National Oceanic and Atmospheric Administration (NOAA), and the U.S. Environmental Protection Agency (EPA).
