
5 Chapter 5 Weather and climate
R. Adam Dastrup
5.1 Defining Climate and Weather
When it comes to defining climate, it is often said that “climate is what you expect; weather is what you get.” That is to say; climate is the statistically-averaged behavior of the weather. In reality, it is a bit more complicated than that, as climate involves not just the atmosphere, but the behavior of the entire climate system—the complex system defined by the coupling of the atmosphere, oceans, ice sheets, and biosphere. Weather is the current conditions of the atmosphere for a specific location and time.
Having defined climate, we can begin to define what climate change means. While the notion of climate is based on some statistical average of the behavior of the atmosphere, oceans, etc., this average behavior can change over time. That is to say, what you “expect” of the weather is not always the same. For example, during El Niño years, we expect it to be wetter in the winter in California and snowier in the southeastern U.S., and we expect fewer tropical storms to form in the Atlantic during the hurricane season. So, the climate itself varies over time.
If climate is always changing, then is climate change by definition always occurring? Yes and No. A hundred million years ago, during the early part of the Cretaceous period, dinosaurs roamed a world that was almost certainly warmer than today. The geological evidence suggests, for example, that there was no ice even at the North and South poles. So global warming can happen naturally, right? Certainly, but why was the Earth warmer at that time?
So, the significant climate changes in Earth’s geologic past were closely tied to changes in the greenhouse effect. Those changes were natural. The changes in greenhouse gas concentrations that scientists talk about today are, however, not natural. They are due to human activity.
The scientific consensus demonstrates that climate change in the 21st century is necessarily a human problem. People are causing climate change through their everyday actions and the socioeconomic forces underlying those actions. At the same time, people are feeling the consequences of climate change through various impacts on things they value and through the responses they are making to address climate change.
Climate is the average of weather (typically precipitation and temperature) in a particular location over a long period, usually for at least 30 years. A location’s climate can be described by its air temperature, humidity, wind speed and direction, and the type, quantity, and frequency of precipitation. Climate can change, but only over long periods of time. The climate of a region depends on its position relative to many things.
The Climate System
The climate system is comprised of five natural components: atmosphere, hydrosphere, cryosphere, land surface, and biosphere. The atmosphere is the envelope of gases that surrounds Earth, including the naturally occurring greenhouse gases that warm the planet’s surface. The hydrosphere includes all of Earth’s liquid water and gaseous water (water vapor), whereas the cryosphere includes all frozen water (ice). Note that the cryosphere is technically part of the hydrosphere, but climate scientists usually treat it as a separate component of the climate system because its physical properties differ from those of water and water vapor. The land surface does not include water- or ice-covered surfaces but consists of all other vegetated and non-vegetated surfaces. The biosphere is the realm of life and is found in all of the other natural components, especially the hydrosphere and land surface. The biota is made up of and requires the presence of air, water, and mineral matter – that is, material from the atmosphere, hydrosphere, and land – to exist. Several external forces influence the five climate system components, with radiation from the Sun being most important. Climate scientists consider the impact of human activities on the climate system another example of external forcing.
Why Understanding Climate is Important
Everything in the lighter shading would be flooded in the transition from the ice age to pre-industrial modern climate. But what sort of effort would that have taken? It turns out that the natural increase in atmospheric carbon dioxide that led to the thaw after the last Ice Age was an increase from 180 parts per million (ppm) to about 280 ppm. This was a smaller increase than the present-time increase due to human activities, such as fossil fuel burning, which thus far have raised carbon dioxide levels from the pre-industrial value of 280 ppm to a current level of over 400 ppm–a level which is increasing by 2 ppm every year. So, arguably, if the dawn of industrialization had occurred 18,000 years ago, we may very likely have sent the climate from an ice age into the modern pre-industrial state.
How long it would have taken to melt all of the ice is not precisely known, but it is conceivable it could have happened over a period as short as two centuries. The area ultimately flooded would be considerably larger than that currently projected to flood due to the human-caused elevation of carbon dioxide that has taken place so far. The hypothetical city of “Old Orleans” would have to be relocated from its position in the Gulf of Mexico 100+ miles off the coast of New Orleans to the current location of “New Orleans”.
By some measures, human interference with the climate back then, had it been possible, would have been even more disruptive than the current interference with our climate. Yet that interference would simply be raising global mean temperatures from those of the last Ice Age to those that prevailed in modern times prior to industrialization. What this thought experiment tells us is that the issue is not whether some particular climate is objectively “optimal”. The issue is that human civilization, natural ecosystems, and our environment are heavily adapted to a particular climate — in our case, the current climate. Rapid departures from that climate would likely exceed the adaptive capacity that we and other living things possess, and cause significant consequent disruption in our world.
5.2 Controls of Climate
The climate system reflects an interaction between a number of critical sub-systems or components. In this chapter, we will focus on the components most relative to modern climate change: the atmosphere, hydrosphere, cryosphere, and biosphere. The atmosphere is, of course, a critical component of the climate system, and the one we will spend the most time talking about.
Composition of the Atmosphere
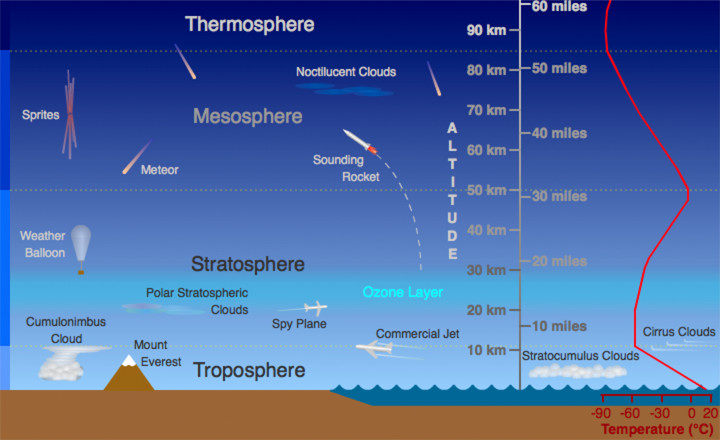
The atmosphere is mostly nitrogen and oxygen, with trace amounts of other gases. Most atmospheric constituents are well mixed, which is to say, these constituents vary in constant relative proportion, owing to the influence of mixing and turbulence in the atmosphere. The assumption of a well-mixed atmosphere and the assumption of ideal gas behavior were both implicit in our earlier derivation of the exponential relationship of pressure with height in the atmosphere.

There are, of course, exceptions to these assumptions. Ozone is primarily found in the lower stratosphere (though some are produced near the surface as a consequence of photochemical smog). Some gases, such as methane, have reliable sources and sinks and are therefore highly variable as a function of region and season.
Atmospheric water vapor is highly variable in its concentration, and, undergoes phase transitions between solid, liquid, and solid form during normal atmospheric processes (i.e., evaporation from the surface, and condensation in the form of precipitation as rainfall or snow).
Of particular significance in considerations of atmospheric composition are greenhouse gases (carbon dioxide, water vapor, methane, and some other trace gases) because of their radiative properties and, precisely, their role in the greenhouse effect. The greenhouse effect is the process by which radiation from Earth’s atmosphere warms the surface of the planet to a temperature above what it would be without the atmosphere.
If a planet’s atmosphere contains greenhouse gases, it will radiate energy in all directions. Part of this radiation is directed towards the surface, warming it. The strength and intensity of the greenhouse effect will depend on the atmosphere’s temperature and on the number of greenhouse gases that the atmosphere contains.

The term “greenhouse effect” is a misnomer that arose from a faulty analogy with the effect of sunlight passing through glass and warming a greenhouse. The way a greenhouse retains heat is fundamentally different, as a greenhouse works mostly by reducing airflow, so that warm air is kept inside.

Earth’s natural greenhouse effect is critical to supporting life. Human activities, mainly the burning of fossil fuels and clearing of forests, have strengthened the greenhouse effect and caused global warming.
Seasonal and latitudinal dependence of energy balance
The Earth’s climate is a solar powered system. So to truly understand Earth’s climate, an understanding of the planet’s energy balance is essential. An interactive animation provided below allows you to explore the balance of incoming and outgoing sources of energy within the climate system. A brief tutorial is provided below, first with the short wave component and then the longwave component of the energy budget.
Now explore these animations by yourself, at your own pace. It takes some time to absorb all of the information that is contained here. Start with the short wave energy budget. Once you are satisfied that you have got that down, go on to the somewhat more complex longwave energy budget by clicking the button at the end of the first animation.
Consider how incoming and outcoming energy sources of shortwave and longwave radiation achieve a net balance:
- At the surface
- Within the atmosphere
- At the top of the atmosphere

Next, let us note that the above picture represents average climate conditions, that is, averaged over the entire Earth’s surface, and averaged over time. However, in reality, the incoming distribution of radiation varies in both space and time. We measure the radiation in terms of power (energy per unit time) per unit area, a quantity we term intensity or energy flux, which can be measured in watts per square meter (W/m2).
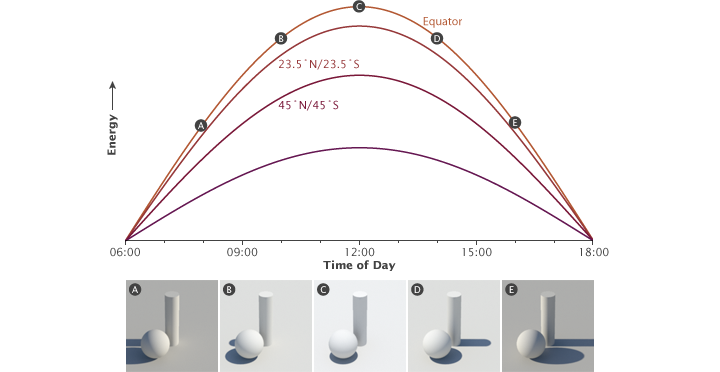
The dominant spatial variation occurs with latitude. On average, there is roughly 343 W/m2 of incoming shortwave solar radiation that is incident on the Earth, averaged over time, and the Earth surface area. There is more incoming solar radiation arriving at the surface near the equator than near the poles. On average, roughly 30 percent, or about 100 W/m2 of this incident radiation is reflected out to space by clouds and reflective surfaces of the Earth, such as ice and desert sand, leaving roughly 70 percent of the incoming solar radiation to be absorbed by the Earth’s surface. The portion that is reflected by clouds and by the surface also varies substantially with latitude, owing to the latitudinal variations in cloud and ice cover.

It is also worth noting that the incoming solar radiation is not constant in time. The output of the Sun, called solar constant, can vary by small amounts on timescales of decades and longer. During the Earth’s early evolution, billions of year ago, the Sun was probably about 30 percent less bright than it is today – indeed, explaining how the Earth’s climate could have been warm enough to support life back then remains somewhat of a challenge, known as the “Faint Young Sun” paradox.
Even more dramatic changes in solar insolation take place on shorter timescales – the diurnal and annual timescale. These changes, however, do not have to do with the net output of the Sun, but rather the distribution of solar insolation over the Earth’s surface. This distribution is influenced by the Earth’s daily rotation about its axis, which of course leads to night and day, and the annual orbit of the Earth about the Sun, which leads to our seasons. While there is a small component of the seasonality associated with changes in the Earth-Sun distance during the course of the Earth’s annual orbit about the Sun (because of the slightly elliptical nature of the orbit), the primary reason for the seasons is the tilt of Earth’s rotation axis relative to the plane defined by the Earth and the Sun, which causes the Northern Hemisphere and Southern Hemisphere to be preferentially oriented either towards or away from the Sun, depending on the time of year.
The consequence of all of this is that the amount of shortwave radiation received from the Sun at the top of the Earth’s atmosphere varies as a function of both times of day and season. Subtle changes in the Earth’s orbital geometry (i.e., changes in the tilt of the axis, the degree of ellipticity of the orbit, and the slow precession of the orbit) are responsible for the coming and going of the ice ages over tens of thousands of years.
ATMOSPHERIC CIRCULATION
We have seen above that the distribution of solar insolation over the Earth’s surface changes over the course of the seasons, with the Sun, in a relative sense, migrating south and then north of the equator over the course of the year – that annual migration, between 23.5 degrees S and 23.5 degrees N, defines the region we call the tropics. As the heating by the Sun migrates south and north within the tropics over the course of the year, so does the tendency for rising atmospheric motion. As we have seen, warmer air is less dense than cold air, and where the Sun is heating the surface, there is a tendency for convective instability, i.e., the unstable situation of having relatively light air underlying relatively heavy air. Where that instability exists, there is a tendency for rising motion in the atmosphere, as the warm air seeks to rise above the colder air. As a result, there is a tendency for rising air (and with it, rainfall) in a zone of low surface pressure known as the Intertropical Convergence Zone or ITCZ, which is centered roughly at the equator, but shifts north and south with the migration of the Sun about the equator over the course of the year. Due to the greater thermal inertia of the oceans relative to the land surface, the response to the shifting solar heating is more sluggish over the ocean, and the ITCZ shows less of a latitudinal shift with the seasons. By contrast, over the most extensive land masses (e.g., Asia), the seasonal shifts can be quite pronounced, resulting in dramatic shifts in wind and rainfall patterns such as the Indian monsoon.

The air rising in the tropics then sinks in the subtropics, forming a subtropical band of high surface pressure and low precipitation associated with the prevailing belt of deserts in the subtropics of both hemispheres. The resulting pattern of circulation of the atmosphere is known as the Hadley Cell circulation. In sub-polar latitudes, there is another region of low surface pressure, associated again with rising atmospheric motion and rainfall. This region is known as the polar front. These belts of high and low atmospheric surface pressure and the associated patterns of atmospheric circulation also shift south and north over the course of the year in response to the heating by the Sun.

We have seen above that there is an imbalance between the absorbed incoming short wave solar radiation and the emitted outgoing longwave terrestrial radiation, with a relative surplus within the tropics and a relative deficit near the poles. We, furthermore, noted that the atmosphere and ocean somehow relieve this imbalance by transporting heat laterally, through a process known as heat advection. We are now going to look more closely at how the atmosphere accomplishes this transport of heat. We have already seen one crucial ingredient, namely the Hadley Cell circulation, which has the net effect of transporting heat poleward from where there is a surplus to where there is a deficit.
Wind patterns in the extratropics also serve to transport heat poleward. The lateral wind patterns are primarily governed by a balance between the previously discussed pressure gradient force (acting in this case laterally rather than vertically), and the Coriolis force, a compelling force that exists because the Earth is itself rotating. This balance is known as the geostrophic balance.
The Coriolis force acts at right angles to the direction of motion: 90 degrees to the right in the Northern Hemisphere and 90 degrees to the left in the Southern Hemisphere. The pressure gradient force is directed from regions of high surface pressure to regions of low surface pressure. As a consequence, geostrophic balance leads to winds in the mid-latitudes, between the subtropical high-pressure belt and the sub-polar low-pressure belt of the polar front, blowing from west to east. We call these westerly winds. For reasons that have to do with the vertical thermal structure of the atmosphere, and the combined effect of the geostrophic horizontal force balance and hydrostatic vertical force balance in the atmosphere, the westerly winds become stronger aloft, leading to the intense regions of high wind known as the jet streams in the midlatitude upper troposphere.
Conversely, winds in the tropics tend to blow from east to west. These are known as easterly winds or, by the perhaps more familiar term, the trade winds. In the Northern Hemisphere, geostrophic balance implies counter-clockwise rotation of winds about low-pressure centers and clockwise rotation of winds about high-pressure centers. The directions are opposite in the Southern Hemisphere.
Due to the effect of friction at the Earth’s surface, there is an additional component to the winds which blows out from high-pressure centers and in towards low-pressure centers. The result is spiraling in (convergence) towards low-pressure centers and a spiraling out (divergence) about high-pressure centers. The convergence of the winds toward the low-pressure centers is associated with the rising atmospheric motion that occurs within regions of low surface pressure. The divergence of the winds away from the high-pressure centers is associated with the sinking atmospheric motion that occurs within regions of high atmospheric pressure.
The inward spiraling low-pressure systems in mid-latitudes constitute the polar front, which separates the coldest air masses near the poles from the warmer air masses in the subtropics. It is the unstable property of having clashing air masses with vastly different temperature characteristics, known as baroclinic instability, that is responsible for the existence of extratropical cyclones. The energy that drives the extratropical cyclones comes from the work done as surface air is lifted along frontal (i.e., cold front and warm front) boundaries. These extratropical storm systems relieve high-latitude deficit of radiation by mixing cold polar and warm subtropical air and, in so doing, transporting heat poleward, along with the latitudinal temperature gradient.
CONTINENTAL POSITION
When a particular location is near a large body of water, the local climate will be directly impacted, creating a maritime climate. Temperatures typically vary only slightly across the day and year. For a location to have a true maritime climate, the winds must most frequently come off the sea.
When a particular location is not located near any large body of water, the region will typically experience a continental climate. A continental climate is more extreme, with more significant temperature differences between day and night and between summer and winter.
OCEAN circulation
While we have focused primarily on the atmosphere thus far, the oceans, too, play a crucial role in relieving the radiation imbalance by transporting heat from lower to higher latitudes. The oceans also play a crucial role in both climate variability and climate change, as we will see. There are two primary components of ocean circulation. The first component is the horizontal circulation, characterized by wind-driven ocean gyres.

The major surface currents are associated with ocean gyres. These include the warm poleward western boundary currents such as the Gulf Stream, which is associated with the North Atlantic Gyre, and the Kuroshio Current associated with the North Pacific Gyre. These gyres also contain cold equatorward eastern boundary currents such as the Canary Current in the eastern North Atlantic and the California Current in the western North Atlantic. Similar current systems are found in the Southern Hemisphere. The horizontal patterns of ocean circulation are driven by the alternating patterns of wind as a function of latitude, and, in particular, by the tendency for westerly winds in mid-latitudes and easterly winds in the tropics, discussed above.
An essential additional mode of ocean circulation is the thermohaline circulation, which is sometimes referred to as the meridional overturning circulation or MOC. The circulation pattern is shown below. By contrast with the horizontal gyre circulations, the MOC can be viewed as a vertical circulation pattern associated with a tendency for sinking motion in the high-latitudes of the North Atlantic, and rising motion more broadly in the tropics and subtropics of the Indian and Pacific ocean. This circulation pattern is driven by contrasts in density, which are, in turn, primarily due to variations in both temperature and salinity (hence the term thermohaline). The sinking motion is associated with relatively cold, salty surface waters of the subpolar North Atlantic, and the rising motion with the relatively warm waters in the tropical and subtropical Pacific and Indian ocean.
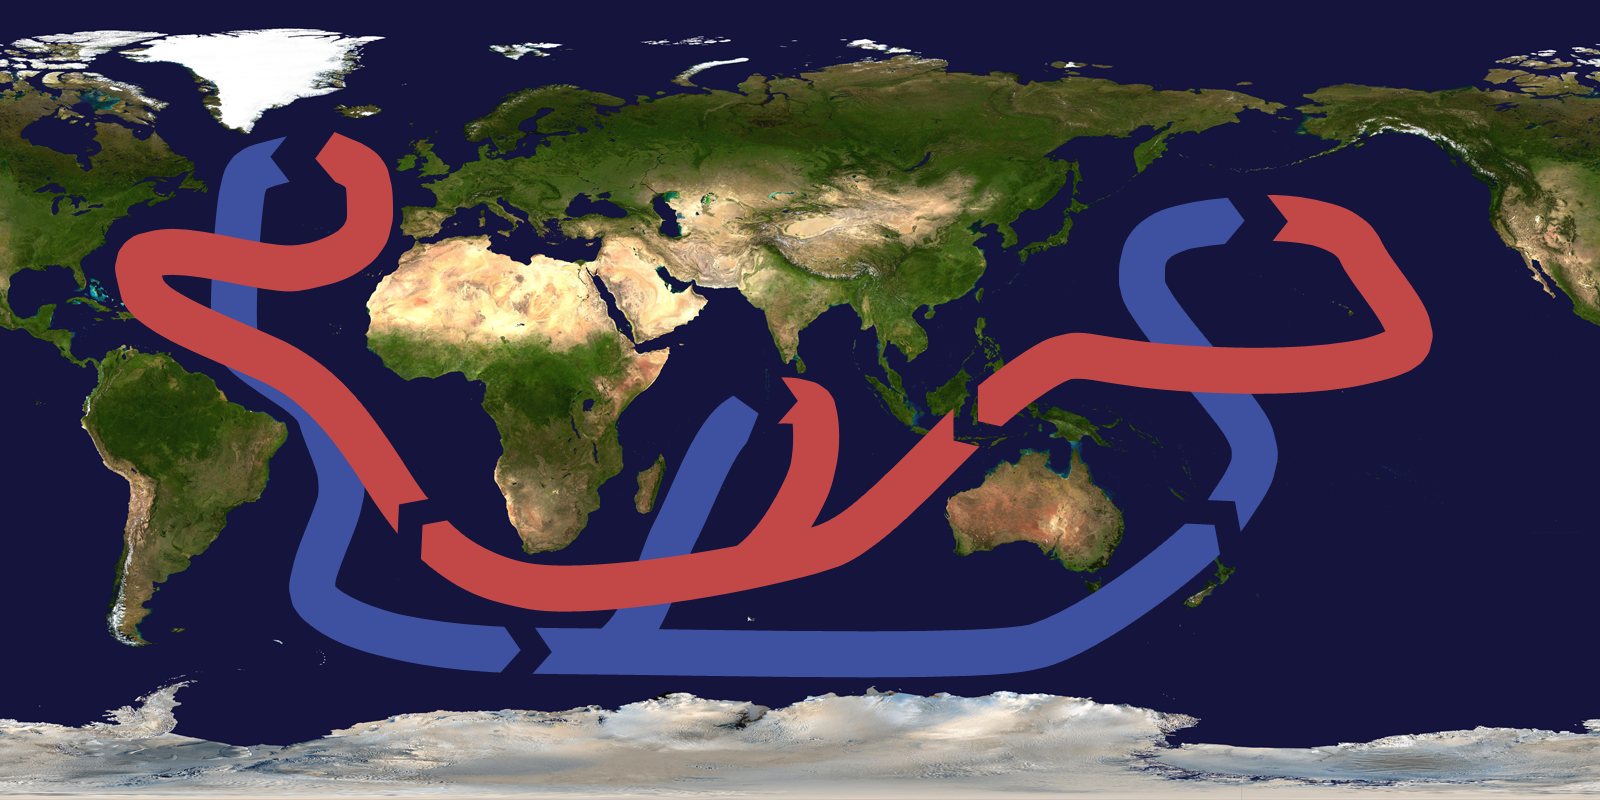
The picture presented above is a highly schematized and simple description of the actual vertical patterns of circulation in the ocean. Nonetheless, the conveyor belt is a useful mnemonic. The northward surface branch of this circulation pattern in the North Atlantic is sometimes erroneously called the Gulf Stream. The Gulf Stream, as discussed above, is part of the circulating waters of the wind-driven ocean gyre circulation. By contrast, the northward extension of the thermohaline circulation in the North Atlantic is rightfully referred to as the North Atlantic Drift. This current system represents a net transport of warm surface waters to higher latitudes in the North Atlantic and is also an essential means by which the climate system transports heat poleward from lower latitudes. Changes in this current system are speculated as having played a key role in past and potential future climate changes.
ALTITUDE AND MOUNTAIN RANGES
Atmospheric pressure and temperature decrease with altitude within the troposphere. The closer molecules are packed together, the more likely they are to collide. Collisions between molecules give off heat, which warms the air. At higher altitudes, the air is less dense, and air molecules are more spread out and less likely to collide. A location in the mountains has lower average temperatures than one at the base of the mountains. In Colorado, for example, Lakewood (5,640 feet) average annual temperature is 62 degrees F (17 degrees C), while Climax Lake (11,300 feet) is 42 degrees F (5.4 degrees C). Mountain ranges have two effects on the climate of the surrounding region. The first is something called the rain shadow effect, which brings warm, dry climate to the leeward side of a mountain range, as described in the Earth’s Atmosphere chapter. The second effect mountains have on climate systems is the ability to separate coastal regions from the rest of the continent. Since a maritime air mass may have trouble rising over a mountain range, the coastal area will have a maritime climate, but the inland area on the leeward side will have a continental climate.
5.3 Climate Zones and Biomes
A climate zone results from the climate conditions of an area: its temperature, humidity, amount and type of precipitation, and the season. A climate zone is reflected in a region’s natural vegetation. Perceptive travelers can figure out which climate zone they are in by looking at the vegetation, even if the weather is unusual for the climate on that day.
The significant factors that influence climate determine the different climate zones. In general, the same type of climate zone will be found at similar latitudes and in similar positions on nearly all continents, both in the Northern and Southern Hemispheres. The one exception to this pattern is the continental climates, which are not found at higher latitudes in the Southern Hemisphere. This is because the Southern Hemisphere land masses are not broad enough to produce a continental climate.
The most common system used to classify climatic zones is the Köppen classification system. This system is based on the temperature, the amount of precipitation, and the times of year when precipitation occurs. Since climate determines the type of vegetation that grows in an area, vegetation is used as an indicator of climate type.

A climate type and its plants and animals make up a biome. The organisms of a biome share specific characteristics around the world because their environment has similar advantages and challenges. The organisms have adapted to that environment in similar ways over time. For example, different species of cactus live on different continents, but they have adapted to the harsh desert in similar ways.
The Köppen classification system recognizes five major climate groups, each with a distinct capital letter A through E. Each lettered group is divided into subcategories. Some of these subcategories are forest (f), monsoon (m), and wet/dry (w) types, based on the amount of precipitation and season when that precipitation occurs.
Compare the Koppen Classification map above with the physical earth map below and compare the similarities.

Tropical Moist Climates (Group A)
Tropical Moist (Group A) climates are found in a band about 15 to 25 degrees North and South of the equator. Broadly speaking, these climates tend to have the following characteristics:
- Temperature: Intense sunshine; each month has an average temperature of at least 18 degrees Celcius (64 degrees Fahrenheit).
- Rainfall: Abundant, at least 150 cm (59 inches) per year.
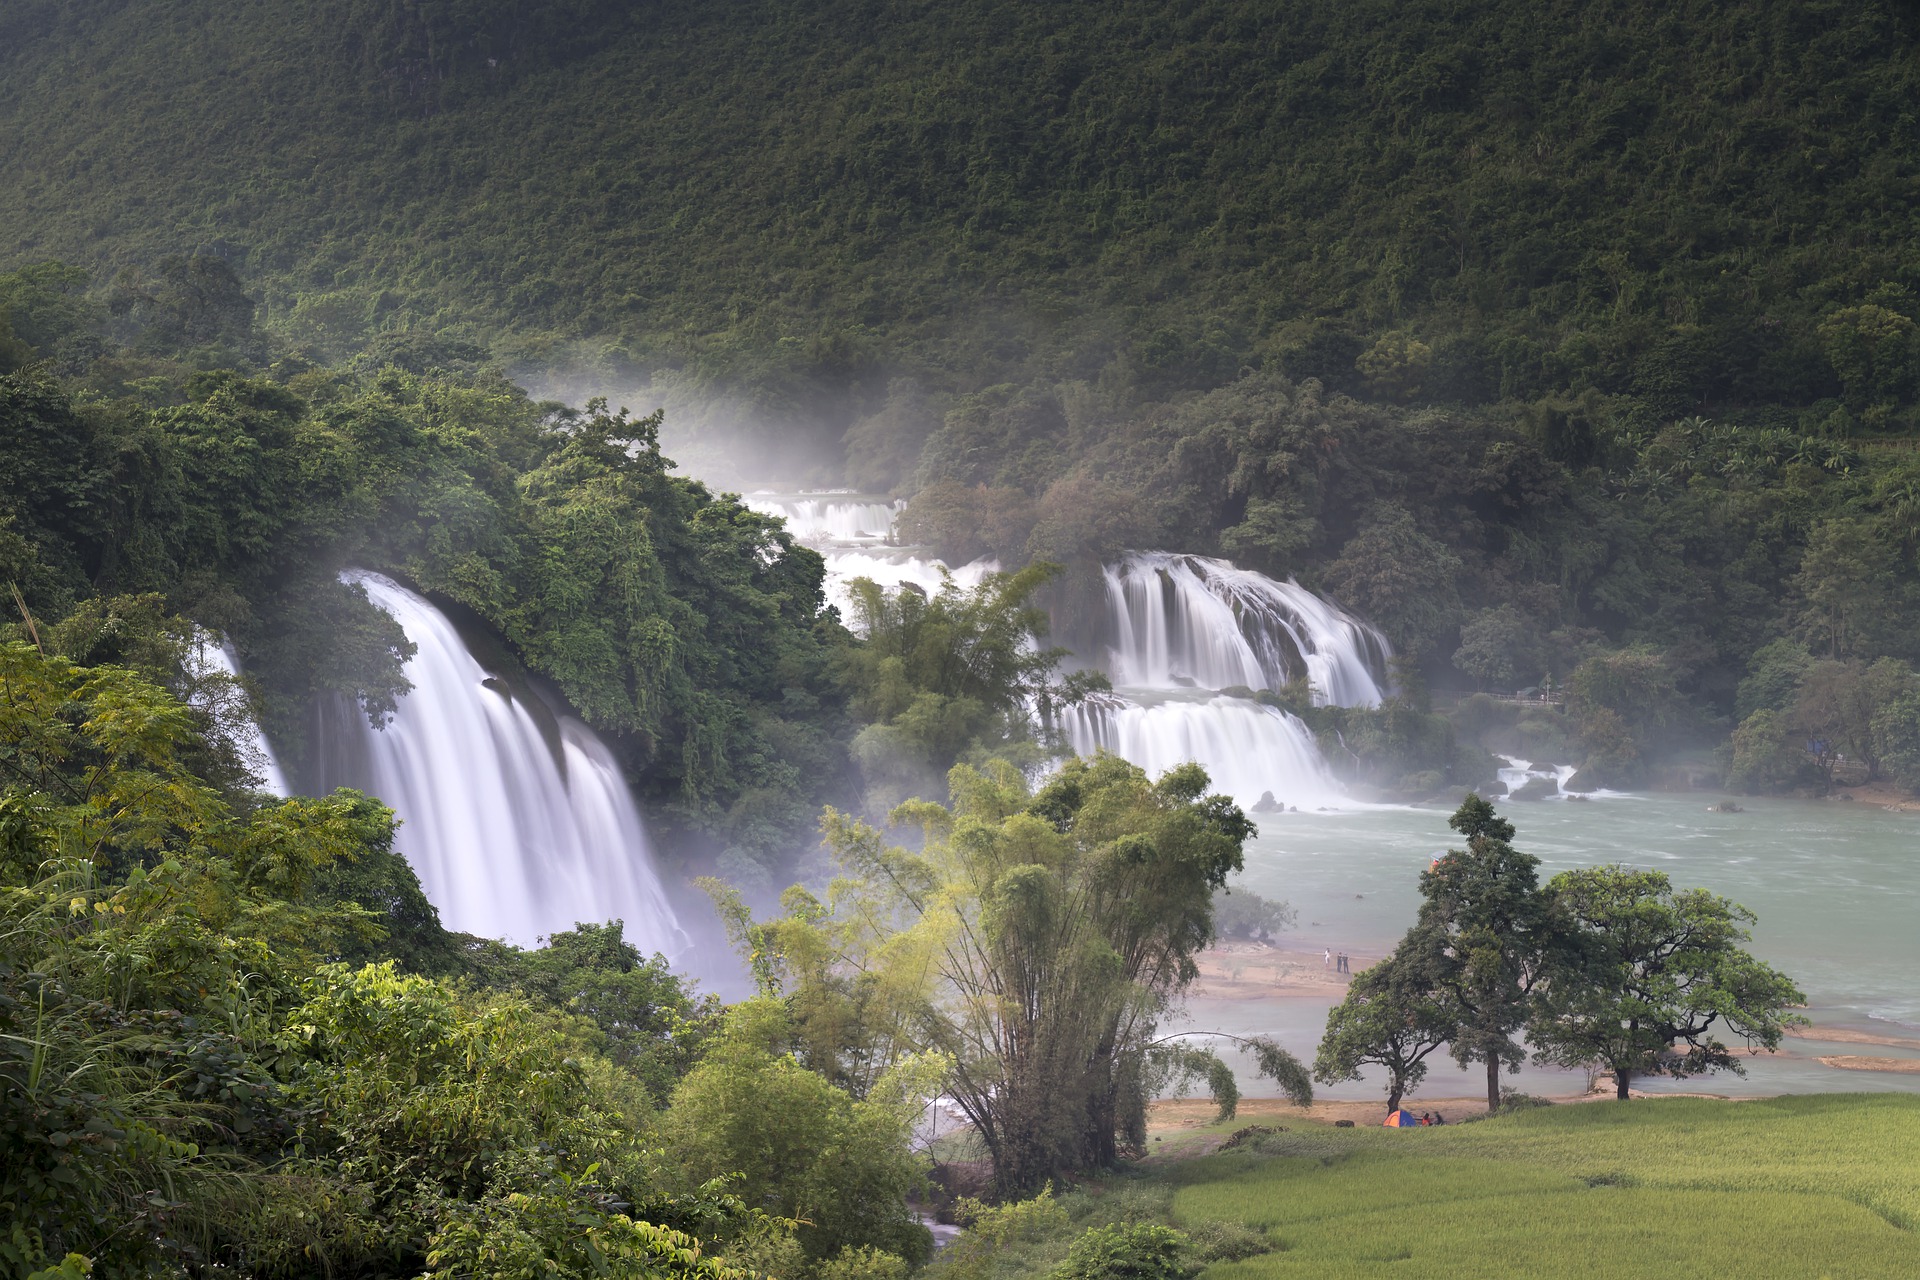
The wet tropics have almost no annual temperature variation and tremendous amounts of rainfall year round, between 175 and 250 cm (65 and 100 inches). These conditions support the tropical rainforest biome. Densely packed, broadleaf evergreen trees dominate tropical rainforests. These rainforests have the highest number of species or biodiversity of any ecosystem.
TROPICAL MONSOON (Am)
The tropical monsoon climate has very low precipitation for one to two months each year. Rainforests grow here because the dry period is short, and the trees survive off of soil moisture. This climate is found where the monsoon winds blow, primarily in southern Asia, western Africa, and northeastern South America.
TROPICAL WET AND DRY
The tropical wet and dry climate lies between about 5 and 20 degrees North and South latitude, around the location of the ITCZ. In the summer, when the ITCZ drifts northward, the zone is wet. In the winter, when the ITCZ moves toward the equator, the region is dry. This climate exists where strong monsoon winds blow from land to sea, such as in India.
Rainforests cannot survive the months of low rainfall, so the typical vegetation is savanna. This biome consists mostly of grasses, with widely scattered deciduous trees and rare areas of denser forests.
Dry Climates (Group B)
The Dry Climates (Group B) have less precipitation than evaporation. Dry climate zones cover about 26 percent of the world’s land area. Broadly speaking, these climates tend to have the following characteristics:
- Temperature: Abundant sunshine. Summer temperatures are high; winters are colder and more prolonged than Tropical Moist climates
- Rainfall: Irregular; several years of drought are often followed by a single year of abundant rainfall
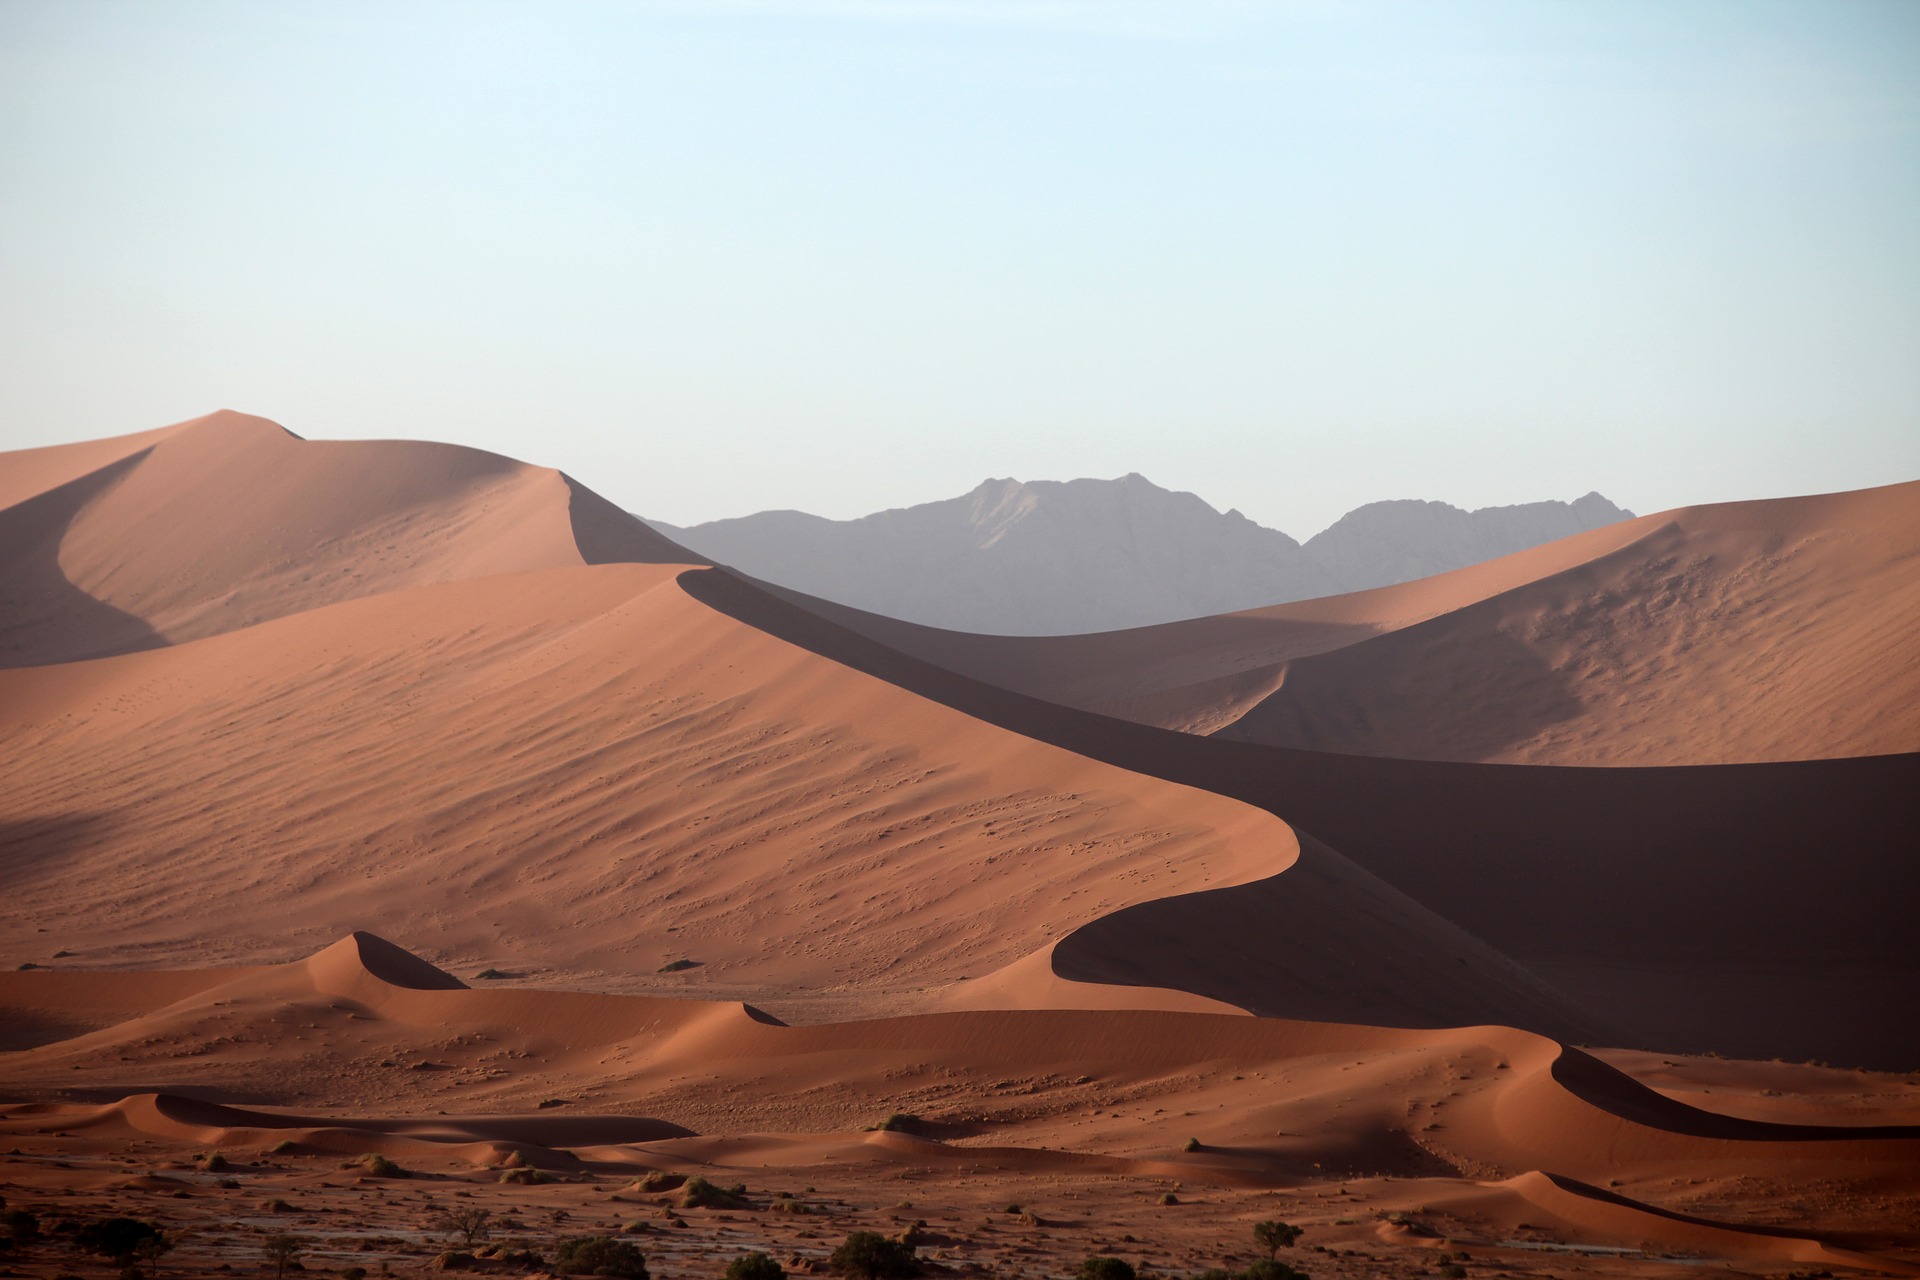
ARID DESERT (Bw)
Low-latitude, arid deserts are found between 15 degrees and 30 degrees North and South, where warm, dry air sinks at high-pressure zones. Vast deserts make up around 12 percent of the world’s lands.
In the Sonoran Desert of the southwestern United States and northern Mexico, skies are clear. The typical weather is sweltering summer days and cold winter nights. Although annual rainfall is less than 25 cm (10 inches), rain falls during two seasons. Pacific storms bring winter rains and monsoons bring summer rains. Since organisms do not have to go too many months without some rain, a unique group of plants and animals can survive in the Sonoran desert.
SEMI-ARID OR STEPPE (Bs)
Higher latitude semi-arid deserts, also called steppe, are found in continental interiors or rainshadows. Semi-arid deserts receive between 20 and 40 cm (8 to 16 inches) of rain annually. The annual temperature range is broad. In the United States, the Great Plains, portions of the southern California coast, and the Great Basin are semi-arid deserts.
Moist Subtropical Mid-Latitude (Group C)
The Moist Subtropical Mid-latitude climates broadly speaking, have the following characteristics:
- Temperature: The coldest month ranges from just below freezing to almost balmy, between -3 to 18 degrees Celcius (27 to 64 degrees Fahrenheit). Summers are mild with average temperatures above 10 degrees Celcius (50 degrees Fahrenheit). Seasons are distinct.
- Rainfall: There is plentiful annual rainfall.
DRY SUMMER SUBTROPICAL OR MEDITERRANEAN CLIMATES (Cs)
The Dry Summer Subtropical climate is found on the western sides of continents between 30 to 45 degrees North and South latitude. Annual rainfall is 30 to 90 cm (14 to 35 inches) most of which comes in the winter.
The climate is typical of coastal California, which sits beneath a summertime high pressure for about five months each year. Land and sea breezes make winters moderate and summers cool. Vegetation must survive long summer droughts. The scrubby, woody vegetation that thrives in this climate is called chaparral.
HUMID SUBTROPICAL (Cfa)
The Humid Subtropical climate zone is found mostly on the eastern sides of continents. Rain falls throughout the year with annual averages between 80 and 165 cm (31 and 65 inches). Summer days are humid and hot, from the lower 30’s up to 40 degrees Celsius (mid-80’s up to 104 degrees Fahrenheit). Afternoon and evening thunderstorms are common. These conditions are caused by warm tropical air passing over the hot continent. Winters are mild, but middle-latitude storms, called cyclones, may bring snow and rain. The southeastern United States, with its hot humid summers and mild, but frosty winters, is typical of this climate zone.
MARINE WEST COAST CLIMATE (Cfb)
Marine West Coast climate zones line western North America between 40 degrees and 65 degrees North latitude, an area known as the Pacific Northwest. Ocean winds bring mild winters and cool summers. The temperature range, both daily and annually, is relatively small. Rain falls year-round, although summers are drier as the jet stream moves northward. Low clouds, fog, and drizzle are typical. In Western Europe, the climate covers a more extensive region since no high mountains are near the coast to block wind blowing off the Atlantic.
Humid Continental (Group D)
Continental (Group D) climates are found in most of the North American interior from about 40 degrees North to 70 degrees North. Broadly speaking, these climates have the following characteristics:
- Temperature: The average temperature of the warmest month is higher than 10 degrees Celcius (50 degrees Fahrenheit) and the coldest month is below -3 degrees Celcius (-27 degrees Fahrenheit).
- Precipitation: Winters are cold and stormy. Snowfall is common, and snow stays on the ground for long periods.
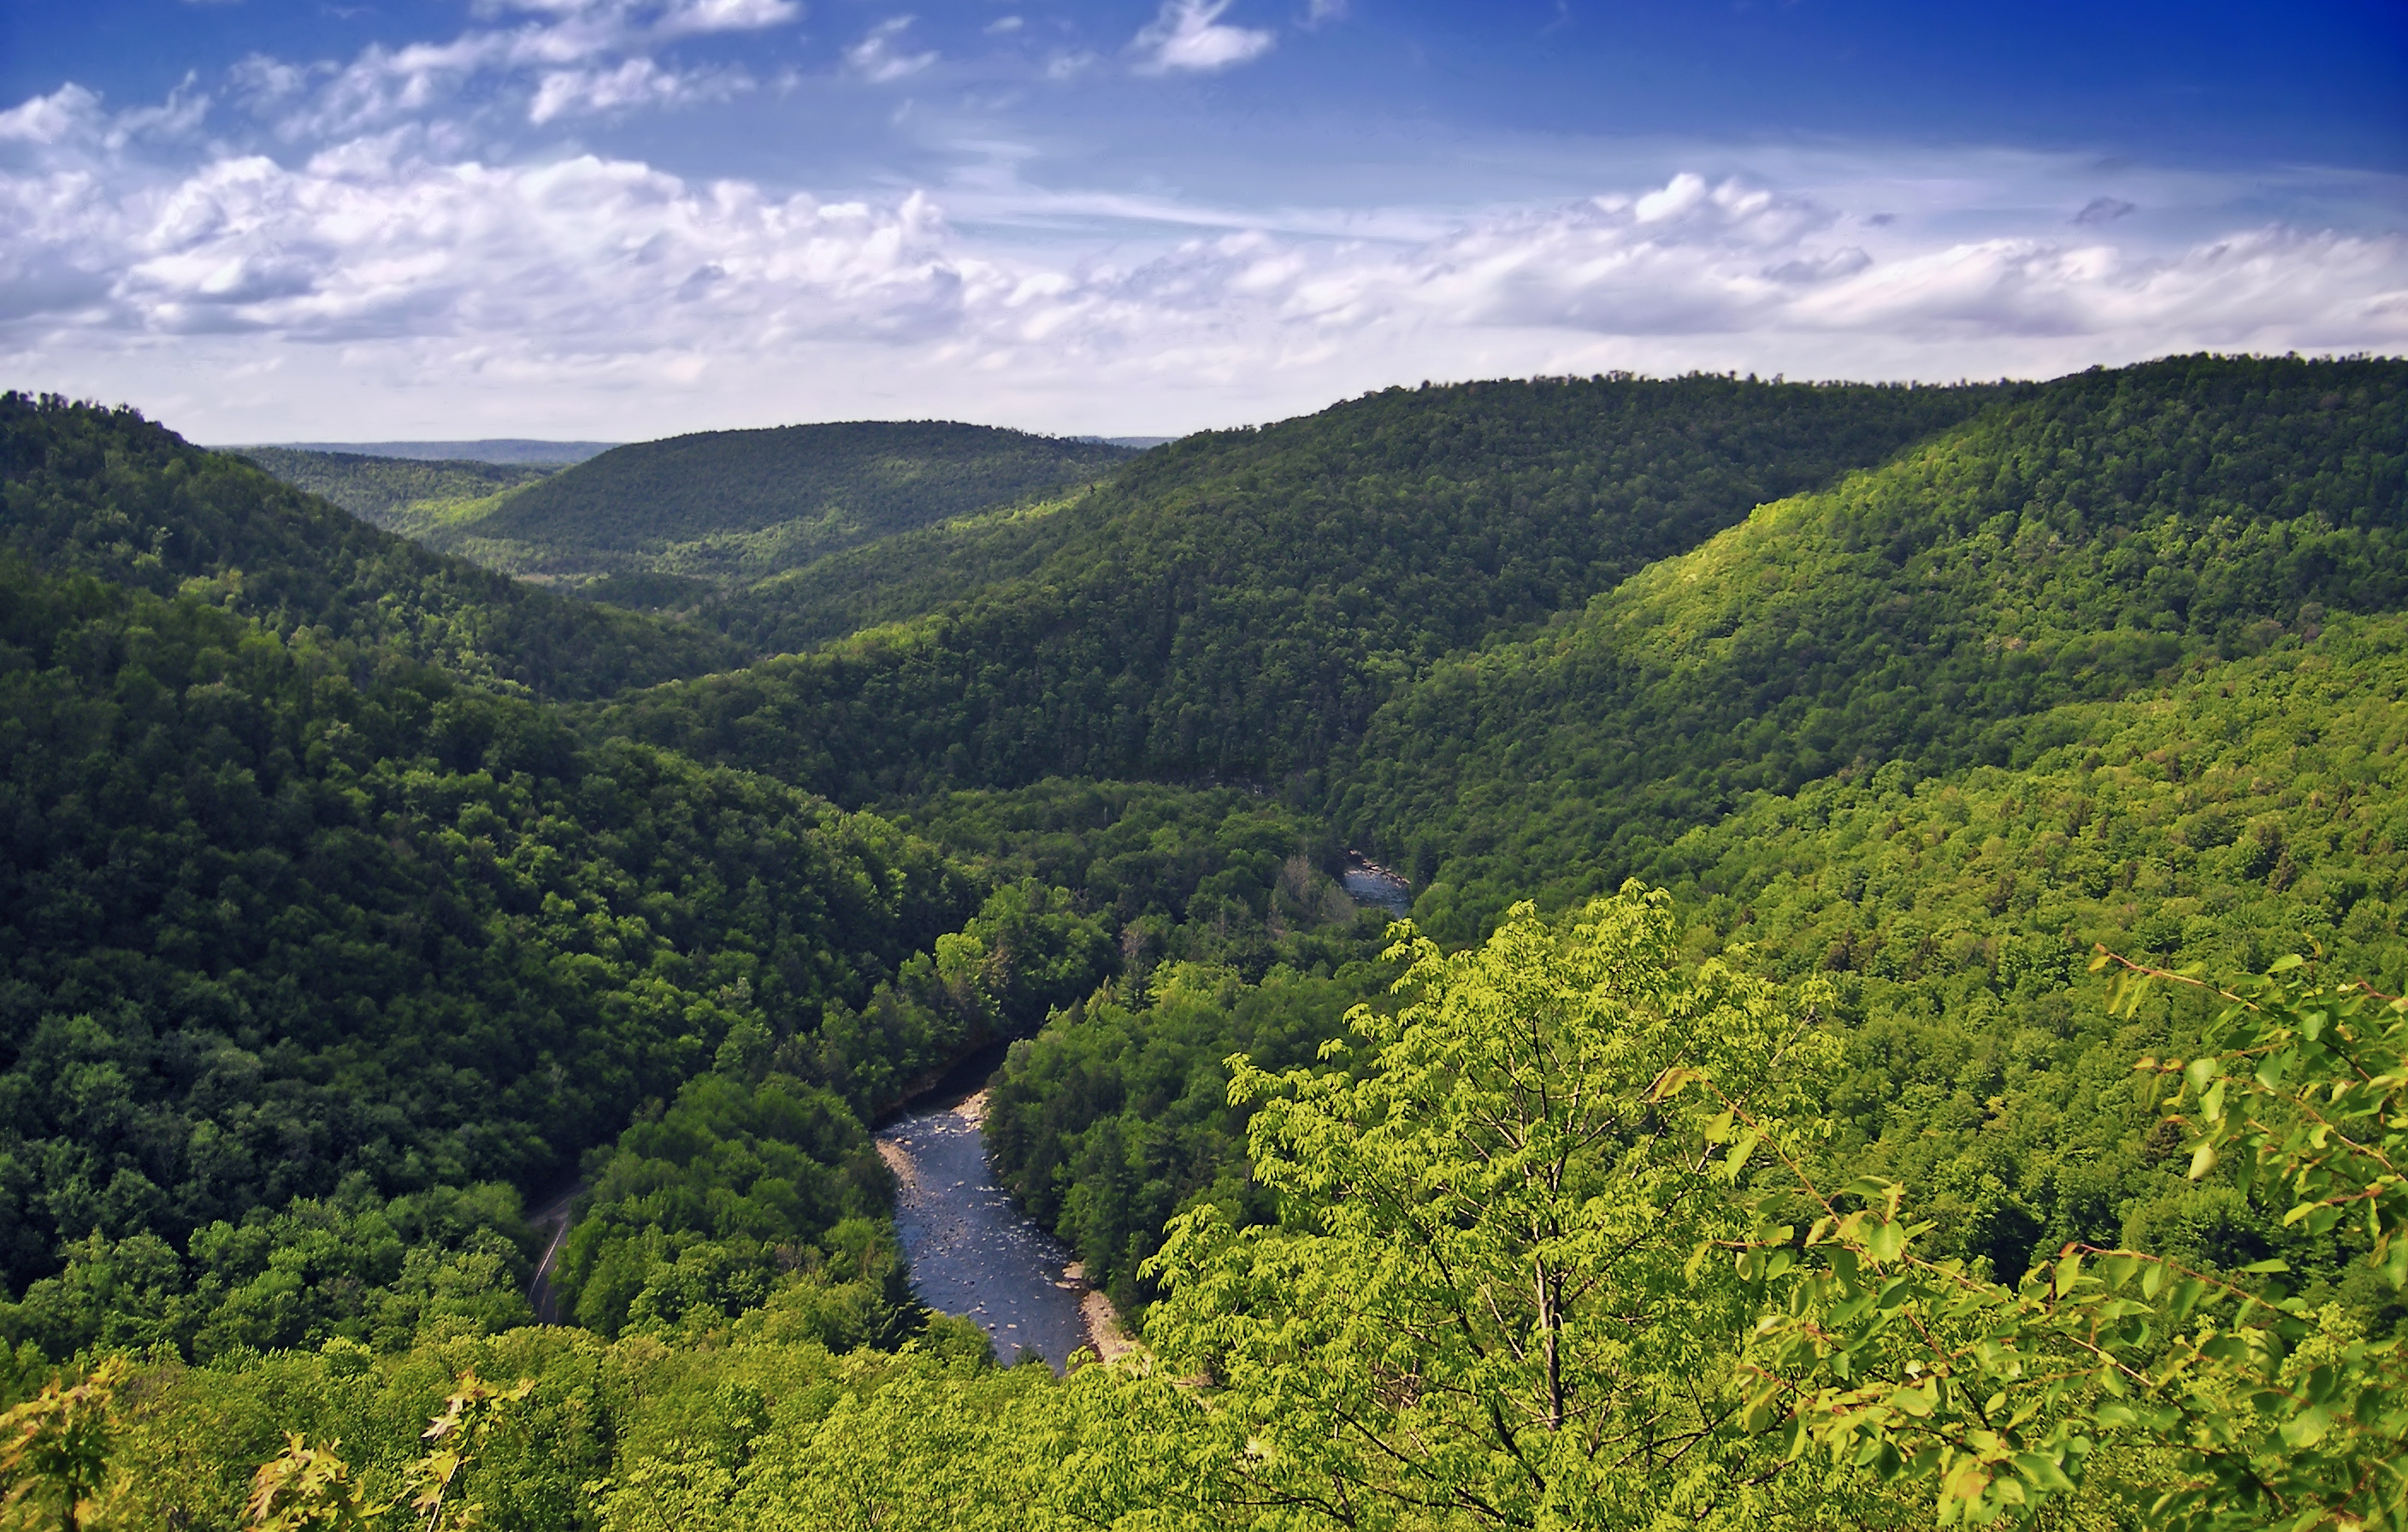
Trees grow in continental climates, even though winters are frigid because the average annual temperature is relatively mild. Continental climates are not found in the Southern Hemisphere because of the absence of a continent vast enough to generate this effect.
HUMID CONTINENTAL (Dfa, Dfb)
The humid continental climates are found around the polar front in North America and Europe. In the winter, middle-latitude cyclones bring chilly temperatures and snow. In the summer, westerly winds bring continental weather and warm temperatures. The average July temperature is often above 20 degrees Celcius (70 degrees Fahrenheit) The region is typified by deciduous trees, which protect themselves in winter by losing their leaves.
The two variations of this climate are based on summer temperatures:
- Dfa, long, hot summers: summer days may be over 38oC (100oF), nights are warm, and the temperature range is broad, perhaps as great as 31oC (56oF). The long summers and high humidity foster plant growth.
- Dfb, long, cool summers: summer temperatures and humidity are lower. Winter temperatures are below -18oC (0oF) for long periods.
SUBPOLAR (Dfc)
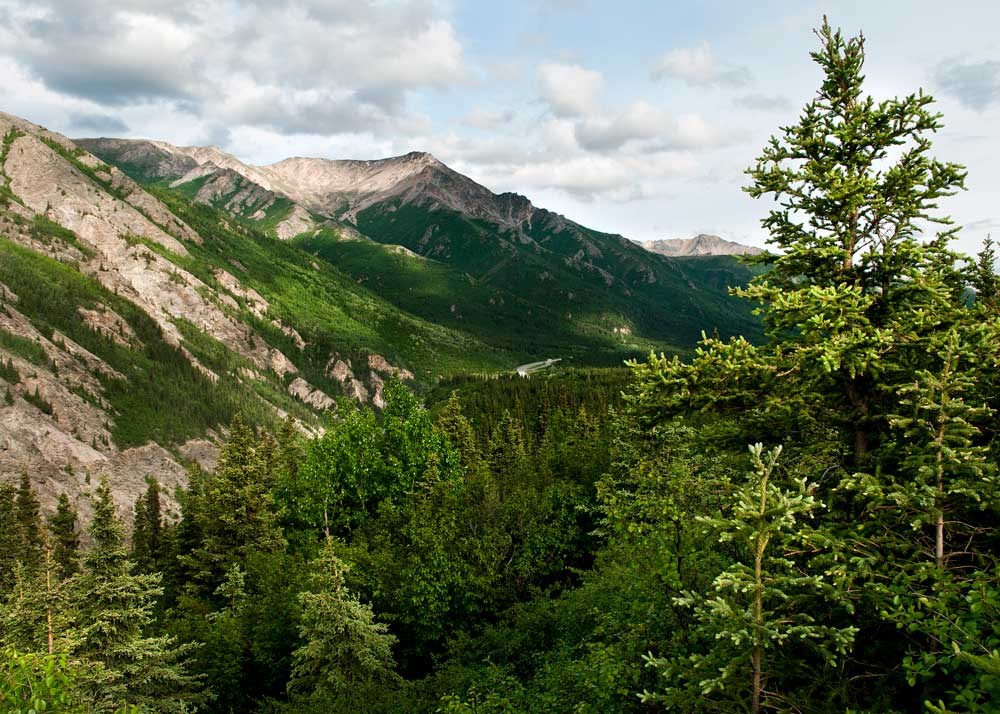
The subpolar climate is dominated by the continental polar air that masses over the frigid continent. Snowfall is light, but cold temperatures keep snow on the ground for months. Most of the approximately 50 cm (20 inches) of annual precipitation falls during summer cyclonic storms. The angle of the Sun’s rays is low, but the Sun is visible in the sky for most or all of the day during the summer, so temperatures may get warm, but are rarely hot. These continental regions have extreme annual temperature ranges. The boreal, coniferous forests found in the subpolar climate are called taiga and have small, hardy, and widely spaced trees. Taiga vast forests stretch across Eurasia and North America.
Polar Climates (Group E)
Polar climates are found across the continents that border the Arctic Ocean, Greenland, and Antarctica. Broadly speaking, these climates tend to have the following characteristics:
- Temperature: Winters are entirely dark and bitterly cold. Summer days are long, but the sun is low on the horizon, so summers are cool. The average temperature of the warmest month at less than 10oC (50oF). The annual temperature range is broad.
- Precipitation: The region is dry with less than 25 cm (10 inches) of precipitation annually; most precipitation occurs during the summer.
POLAR TUNDRA (ET)
The polar tundra climate is continental, with severe winters. Temperatures are so cold that a layer of permanently frozen ground, called permafrost forms below the surface. This frozen layer can extend hundreds of meters thick. The average temperature of the warmest months is above freezing, so summer temperatures defrost the uppermost portion of the permafrost. In winter, the permafrost prevents water from draining downward. In summer, the ground is swampy. Although the precipitation is low enough in many places to qualify as a desert, evaporation rates are also low, so the landscape receives more usable water than a desert.
Because of the lack of ice-free land near the South Pole, there is very little tundra in the Southern Hemisphere. The only plants that can survive the harsh winters and wet summers are small ground-hugging plants like mosses, lichens, small shrubs, and scattered small trees that make up the tundra.
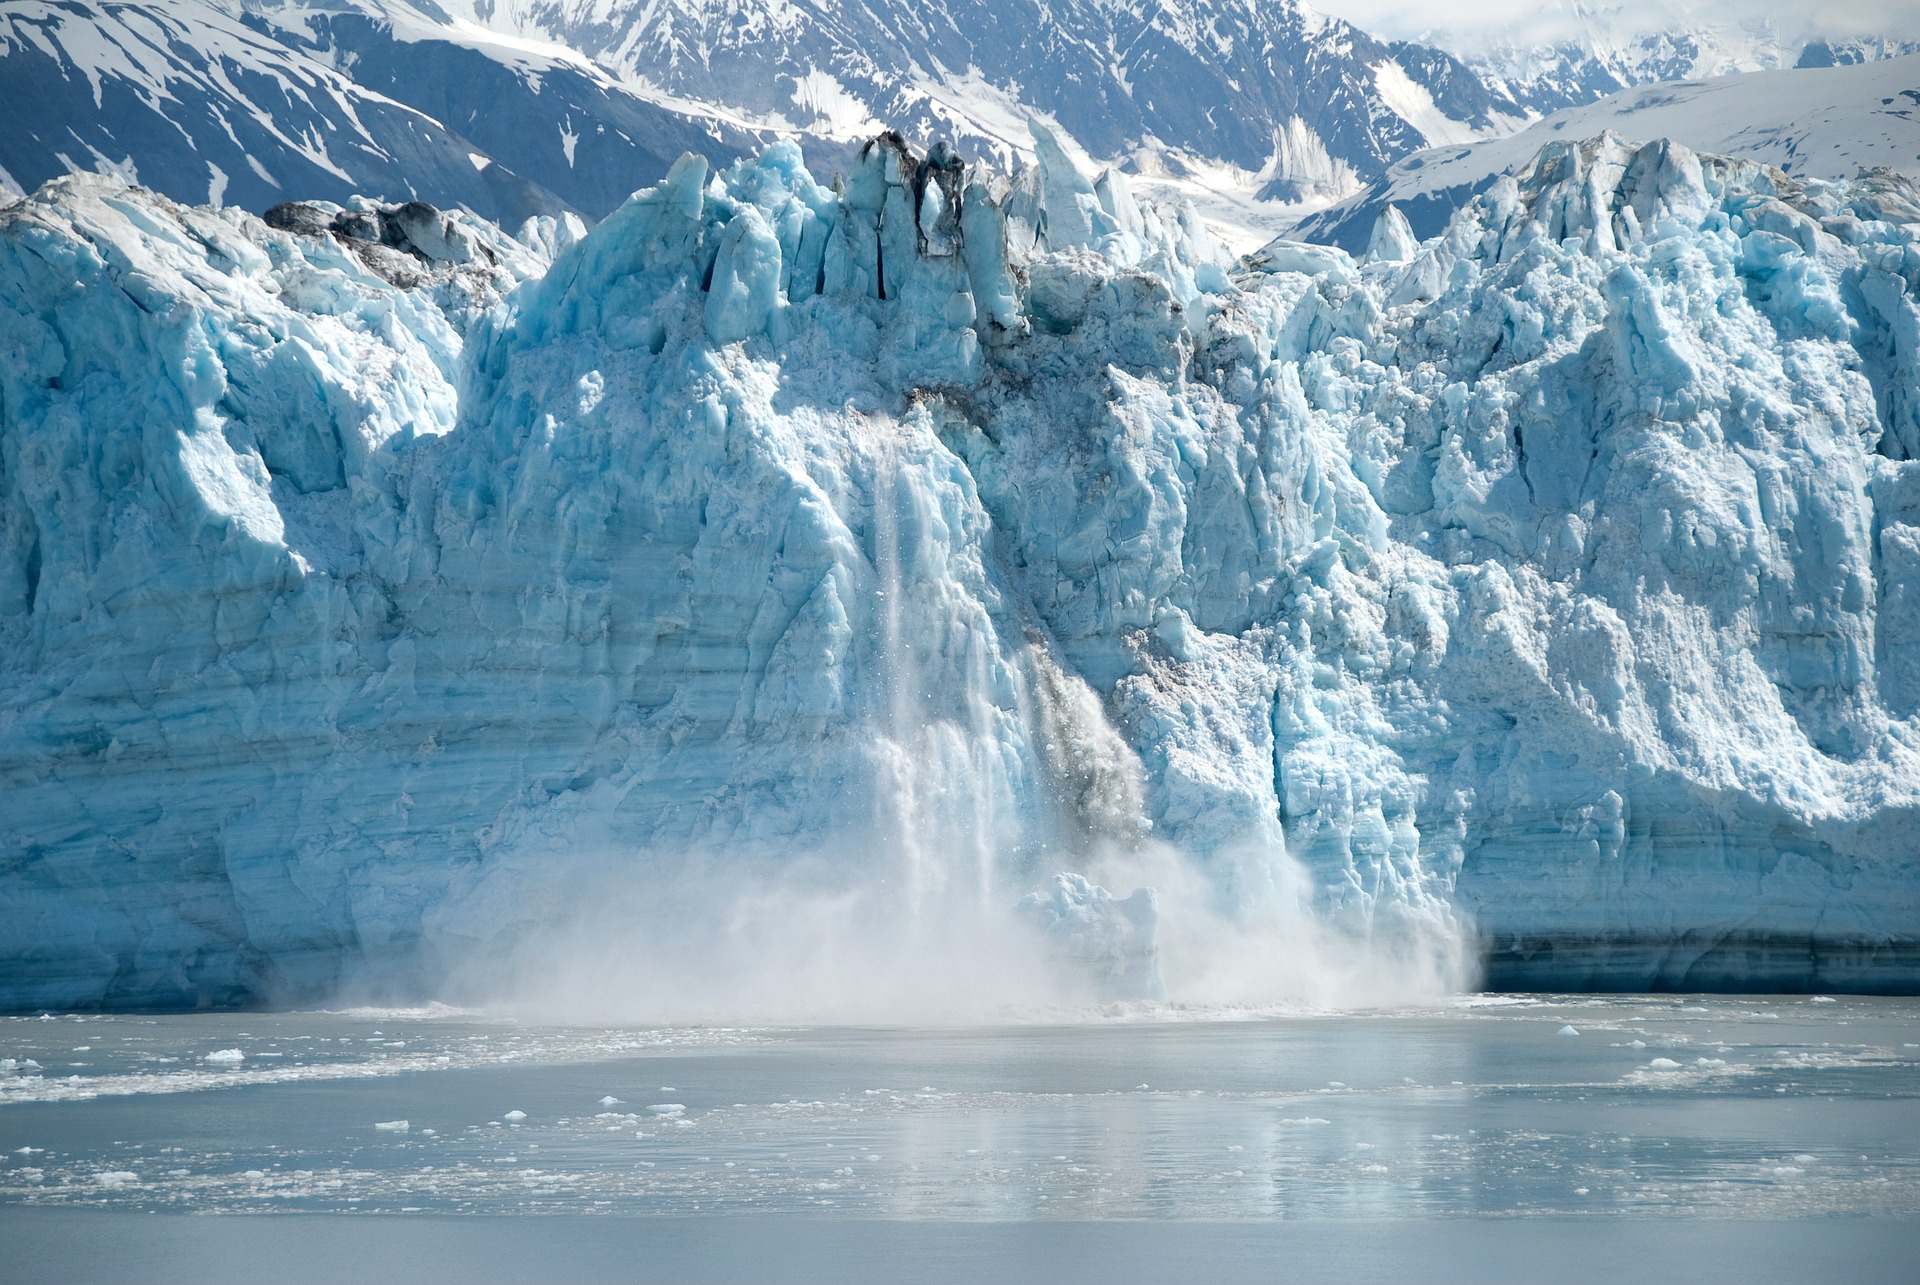
ICE CAPS
Ice caps are found mostly on Greenland and Antarctica, about 9 percent of the Earth’s land area. Ice caps may be thousands of meters thick. Icecap areas have extremely low average annual temperatures, around -29 degrees Celsius (-20 degrees Farenheight ) at Eismitte, Greenland. Precipitation is low because the air is too cold to hold much moisture. Snow occasionally falls in the summer. The video below and related article from NASA highlights how the sea ice wintertime extent was the seventh-lowest ever in 2019.
Highland Climates (Group H)
When climate conditions in a small area are different from those of the surroundings, the climate of the small area is called highland or microclimates. The microclimate of a valley may be cool relative to its surroundings since cold air sinks. The ground surface may be hotter or colder than the air a few feet above it, because rock and soil gain and lose heat readily. Different sides of a mountain will have different microclimates. In the Northern Hemisphere, a south-facing slope receives more solar energy than a north-facing slope, so each side supports different amounts and types of vegetation.
Altitude mimics latitude in climate zones. Climates and biomes typical of higher latitudes may be found in other areas of the world at high altitudes.
