
Neuropeptide F mRNA Expression in the Tobacco Hornworm
Aaron Archampong, Howard Community College
Matthew Arminio, Howard Community College
Jade Bucksell, Howard Community College
Shiva Deljookorani, Howard Community College
Biniam Teferedegn, Howard Community College
Mentored by: Hannah Pie, Ph.D. & Heather Lemko, Ph.D.
Abstract
The tobacco hornworm, the larval form of tobacco hawkmoth Manduca sexta, is a common pest to plants of the family Solanaceae which includes tobacco, tomato, and eggplant. The molecular mechanisms underlying the feeding behaviors and plant preferences of M. sexta are not understood. Neuropeptide Y (NPY) is one the most important regulators of food intake in the brains of many animals. In rats, mice, and humans increased expression of this gene is associated with motivation to eat and an increase in meal size. Insects such as the fruit fly, Drosophila melanogaster, express an analog gene to NPY known as neuropeptide F (NPF). The aim of our study was to determine if NPF signaling may contribute to the feeding behavior of M. sexta on their preferred plants. We first generated primers for the M. sexta NPF gene and used them to amplify a portion of the NPF gene from DNA extracted from the caterpillars. We then generated new sets of primers to target the mRNA sequences of NPF and actin in M. sexta. We extracted RNA from caterpillars which were newly hatched and never fed, mature caterpillars raised on tomato plants but starved for 48-hr, mature caterpillars recently fed on tomato plants, and mature caterpillars recently fed on turnip plants (a non-preferred plant). We then used the RNA from the gut of each caterpillar to run a reverse transcription followed by quantitative PCR. Our results demonstrated amplification of both actin (a housekeeping gene) and NPF mRNA in each sample but we were unable to quantify the relative amounts of each mRNA. Further, we observed contamination in our assays, indicating that we will need to re-do the assays with new reagents and more careful technique to continue our study of NPF expression in M. sexta caterpillars.
Introduction
The tobacco hornworm, Manduca sexta, is a caterpillar found throughout America. As with most moth and butterfly larvae, the tobacco hornworm is herbivorous. This particular species of caterpillar tends to eat plants of the family Solanaceae. Kinds of solanaceous plants include tomato, tobacco, eggplant and peppers, which are farmed for human consumption. M. sexta has proven to be a pest in feeding on these crops. The negative effects of insecticides encourages the need for alternative methods to protect crops from these caterpillars. In order to devise such methods, there needs to be a greater understanding of the feeding preferences of M. sexta. It is important to identify any causes for these caterpillars to prefer solanaceous plants. Understanding these causes will play a significant role in deterring the larvae from crops. Therefore, this research experimented on the tobacco hornworm in order to correlate gene expression with feeding behavior. The behavioral aspect of the caterpillars’ feeding preference has been observed in prior research performed by Gretes [1]. The present research seeks to observe biological factors that are associated with feeding to compare with behavioral data found in Gretes’ research. Past research has associated neuropeptide Y (NPY) with inducing feeding behavior in animals [2, 3]. Neuropeptide F (NPF) is the homolog gene found in insects. NPF performs the same functions in insects as NPY does in mammals. NPF has been found to affect larval feeding regulation in caterpillars [4]. So, our experiment examined NPF mRNA to correlate the expression of the gene with the eating behavior of the tobacco hornworm.
Methods and Materials
The caterpillars (M. sexta) were obtained from Dr. Gretes’ lab at Howard Community College. A sample was taken from different groups of caterpillar. The groupings were based on the rearing of the caterpillar [1]. The first two groups (Groups 1 and 2) were caterpillars reared with either tomatoes or with turnips until their 5th instar stage (see Figure 1). Another group tested (Group 3) were larvae obtained 24 hours after they hatched prior to feeding. The last group (Group 4) consisted of caterpillars fed tomatoes until their 5th instar stage and then were starved for 24 hours prior to testing.
Upon reaching the 5th instar (Groups 1, 2, and 4), the caterpillars were anesthetized in ice water [1], then dissected to remove the gut and brain. (See Figure 1 for a visual description of Manduca sexta life cycle and instars.) Only gut tissue was used for this analysis because it was determined to have higher amounts of NPF mRNA (data not shown). Caterpillars in the hatched group (Group 3) were immediately flash frozen as whole caterpillars. The amount of caterpillars used in each hatched testing sample varied: the hatched cat 1 had one caterpillar, the hatched cat 4 had four caterpillars and hatched cat 5 sample had five caterpillars.
The standard procedures of the RNeasy plus Mini Kit (Qiagen) were used to extract RNA from the tissues [8]. Briefly, the tissues extracted from the caterpillars were flash frozen in liquid nitrogen and stored at -800 C until used or immediately extracted following immersion in liquid nitrogen. Tissues were homogenized in the lysis buffer containing ethanol and 0.04 M dithiothreitol (DTT) using a Bel Art Microtube Homogenizer and pestle. A genomic DNA (gDNA) elimination column was utilized to remove genomic DNA contamination and to obtain a pure RNA sample. RNA concentrations were next determined by Thermo scientific Nanodrop One Microvolume UV- Vis Spectrophotometer. The A260/A280 ratio was examined for each sample to determine purity.
Primers were designed for NPF mRNA and housekeeping actin gene using the NCBI Primer Blast tool [9]. The IDT Oligo Analyzer tool [10] was then used to check hair pin and complementary issues for primers obtained through the Primer BLAST. Ultimately, a forward and reverse primer set was chosen for both NPF and actin. The standard procedure of Thermo Scientific Verso 1-STEP RT-PCR Hot Start kit [11] were used to test actin and NPF primers.
| Primer | Forward sequence 5’ to 3’ | Reverse sequence 5’ to 3’ | Size (bp) | Tm | GC% |
| NPF 1 | TGGCTGTGGTTTTCCTG | AACATCTCGGCGGTCAA | 137 | 60-61 | 55 |
| NPF 2 | CTGGCTGTGGTTTTCCT | AACATCTCGGCGGTCA | 138 | 60-61 | 55, 58 |
| Actin 1 | CGTGCCCATCTACGAAGGTT | CTGCTCGAAGTCAAGAGCGA | 190 | 60 | 55 |
| Actin 2 | GGGCCAGAAAGACTCCTACG | TCCCAGTTGGTGATGATGCC | 99 | 60 | 60, 55 |
Table 1: Primer sequences and details for NPF and actin primers tested.
The resulting RT-PCR products were examined using a 2% agarose gel in 1x TAE buffer with SYBR green for visualization. Primer set 1 for actin and primer set 2 for NPF were used based on the bands seen from the gel electrophoresis results (Figures 1 and 2).
The standard procedures of the Thermo Scientific Verso 1-STEP RT-qPCR kit [11] were used to examine the actin and NPF gene expression levels within a newly hatched larvae and the guts of a 5th instar caterpillars. Master mixes were prepared for each gene using a final primer concentrations of 0.4 µM. A 0.08X SYBR green concentration was used within each well to quantify amplification (shown in Figure 4). The RT-qPCR was conducted with a Bio-Rad C-1000 Thermal Cycler using the cycle details shown in Table 2. The resulting RT-qPCR products were examined using a 2% agarose gel in 1x TAE buffer with SYBR green for visualization (Figure 5).
| Cycle Detail | Temperature | Time | Number of Cycle |
| RT- cDNA synthesis | 50 | 15 min | 1 |
| Activation | 95 | 15 min | 1 |
| Denaturation | 95 | 15 sec | |
| Annealing | 60 | 30 sec | 40 cycles |
| Extension | 72 | 30 sec |
Table 2: RT-qPCR cycle details use to examine gene expression levels of actin and NPF.
Results
M. sexta caterpillars which had just hatched and never eaten (1st instar) were processed for RNA extraction in entirety (Figure 1). For the more developed caterpillars (5th instar), the head and gut were dissected out to be processed for RNA (Figure 1). The RNA concentrations from each sample are listed in Table 3.
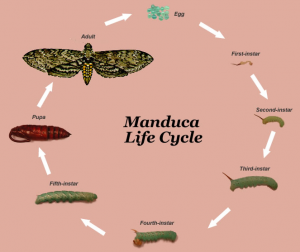
Figure 1: Manduca life cycle. “Hatched” samples are of the 1st instar Reprinted from the University of Wisconsin-Madison Manduca website [6]
| Sample | RNA Concentration (ng/uL) | A260/A280 |
| Hatched 1 | 109.2 | 2.1 |
| Hatched 4 | 774.7 | 2.12 |
| Hatched 5 | 625.8 | 2.16 |
| Starved gut | 1606.5 | 2.18 |
| Tomato gut | 4481.5 | 2.18 |
| Turnip gut | 2047.7 | 2.17 |
Table 3: RNA concentration and purity results for caterpillars used for testing.
The A260/A280 value for all of the samples were between the range of 2.1 and 2.18 (Table 3), which indicates pure RNA with no DNA contamination.
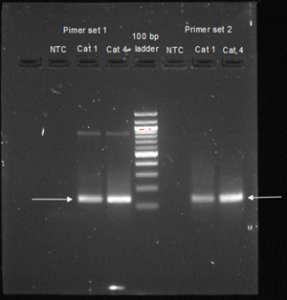
Figure 2: Gel electrophoresis results for NPF primers 1 and 2 tested with hatched caterpillar 1 and 4 samples along with their corresponding no-template controls (NTC). A 100 bp DNA ladder was used as a comparison. Arrows indicate the expected PCR product for each primer set.
The NPF cDNA product amplified by PCR comprised of 199 base pairs (bp). Gel electrophoresis utilizing NPF primer 2 (Figure 2) showed only one band at 138bp. This means that the primer matches the bp size for actin and can be used to replicate actin from our samples. Gel electrophoresis utilizing NPF primer 1 showed bands at 137bp and at about 1000bp, indicating that it produced a secondary, unsuitable product. Primer set 2 was used for the qPCR experiment as it showed only the intended product.
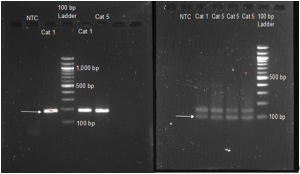
Figure 3: Gel electrophoresis results for actin primer 1 (left) and actin primer 2 (right) tested with hatched cat 1 and 5 samples along with their corresponding no-template controls (NTC). A 100 bp DNA ladder was used as a comparison. Arrows indicate the expected PCR product for each primer set.
The arrows in Figures 2 and 4 indicate what bp size we hoped to find. Gel electrophoresis utilizing actin primer 1 (Figure 3 on left) showed only bands at the expected 199bp. Gel electrophoresis utilizing actin primer 2 (Figure 3 on right) showed the intended band at 99bp as well as an unintended product at about 130bp. Primer set 1 was used for the qPCR experiment as it showed only the intended product.
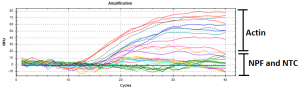
Figure 4: qPCR amplification results of actin and NPF within each caterpillar and the no template controls (NTC).
The amplification curves of the qPCR run are shown in Figure 4. The samples all displayed appreciable amplification of actin, but did not have appreciable amplification of NPF. NPF amplification from all experimental groups was similar to the no-template controls (Figure 4).
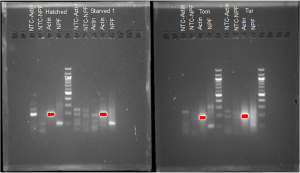
Figure 5: qPCR test for hatched and starved caterpillars (left) and tomato (Tom) and turnip (Tur) fed caterpillars (right). No-template controls (NTCs) for actin and NPF primeres are also shown. A 100 bp DNA ladder was used as a comparison.
qPCR products were examined using agarose gel electrophoresis. The gel results showed contamination in all of the no-template control (NTC) samples and secondary bands in most of the caterpillar samples (Figure 5). The NTC should have no bands as it was designed to contain no genetic material. As there are bands in the NTC lanes, we know some external genetic material ended up in the NTC via the water or master mix. As all of the samples were prepared from the same water and master mix, we can be confident that the other samples were contaminated. In addition, there are many unintentional bands in the NPF lanes when there should only be one. Multiple bands indicate multiple kinds of genetic material in the same samples (contamination).
Conclusions
We expected findings similar to Yue et al. [5] where diminished feeding on an organism would result in diminished NPY mRNA. Sample collection, primer creation, and amplification methodology proved sound for both NPF and actin, as shown by the successful amplification of NPF and actin RNA in all experimental groups. However, measured NPF quantity did not sufficiently rise to accomplish accurate measurement. Contamination is the most likely cause for a lack of sufficient NPF amplification. Primers in the sample was taken up by another unknown nucleic acid, leading to lessened NPF amplification. Upon further testing of the materials, it was discovered that both the water and master mix wells had non-M.sexta DNA contamination that also displayed specificity with the chosen NPF primers, which prevented full amplification of the NPF gene. Lack of successful amplification meant that NPF RNA levels could not be compared between experimental groups.
To prevent contamination and measurement errors in future experiments, we offer several precautionary steps to subsequent researchers. First, reverse transcribe RNA into complementary DNA for more stable storage. In addition, use ethanol and ultraviolet light to sanitize work areas and use individual containers of master mix and water. Finally, troubleshoot the qPCR detection system prior to testing and perform preemptive simple qPCR tests [7].
With the above precautions taken, future research can be conducted in order to quantify differences in tobacco hornworm NPF expression.
Acknowledgements
Howard County Community College, National Science Foundation NSF-STEM Program, Dr. Patti Turner, Dr. Brendan Diamond, Dr. Alex Barr. Special thanks to Dr. Gretes and his students for providing caterpillars for testing.
Contact: matthew.arminio@gmail.com, shiva.deljoo99@gmail.com, biniamsileshi@gmail.com
References
[1] C. Gretes, E. A. Stanwyck, and F. E. Hanson, “Innate and acquired components of oligophagy in the herbivorous lepidopteran, manduca sexta,” Entomologia Experimentalis et Applicata, vol. 160, no. 3, pp. 259-271, 2016.
[2] S. Hanson, M. F. Dallman, “Neuropeptide y (npy) may integrate responses of hypothalamic feeding systems and the hypothalamo-pituitary-adrenal axis,” Journal of Neuroendocrinology, vol. 7, no. 4, pp. 273–279, 1995.
[3] Heilig, E. Widerlöv, “Neurobiology and clinical aspects of neuropeptide y,” Critical Reviews in Neurobiology, vol. 9, no. 2–3, pp. 115–136, 1995.
[4] Yue, and Z. Zhao,(2017). “Feeding regulation by neuropeptide y on asian corn borer ostrinia furnacalis,” Archives of Insect Biochemistry and Physiology, vol. 95, no. 2, May 2017.
[5] University of Wisconsin-Madison, “Manduca,” University of Wisconsin-Madison, [Online]. Available: http://labs.russell.wisc.edu/manduca/lifecycle/. [Accessed March 26, 2019].
[6] T. Motley, J. M. Picuri and C. D. Crowder, “Improved multiple displacement amplification (iMDA) and ultraclean reagents,” BMC Genomics, vol. 15, no. 1, pp. 1-20, 2014.
[7] Qiagen, “RNeasy plus mini handbook,” Qiagen, [online document], 2014. Available: Qiagen, https://www.qiagen.com/us/resources/resourcedetail?id=c8cdc6bf-5bbf-4e3b-a0f4-476da9215012&lang=en [Accessed March 2019].
[8] National Center for Biotechnology Information, “Primer blast,” National Library of Medicine, [Online]. Available: https://www.ncbi.nlm.nih.gov/tools/primer-blast/, [Accessed October 2018].
[9] Integrated DNA Technologies, “Oligoanalyzer tool”, Integrated DNA Technologies,[Online]. Available: https://www.idtdna.com/pages/tools/oligoanalyzer, [Accessed October 2018].
[10] Thermo Scientific, “Product information thermo scientific verso 1-step RT-PCR hot-start kit,” Thermo Scientific, [Online]. Available: https://assets.thermofisher.com/TFS-Assets/LSG/manuals/MAN0012829_Verso_1Step_RT_PCR_Hot_Start_AB1455B_UG.pdf, [Accessed November 2018].
