
|
The Effect of Different Strategies on Winning 6 Nimmt! José Ayala, Howard Community College |
Abstract
The German card game “6 Nimmt!” is a game where the player begins with ten cards, playing one card each round until there are no cards left. The 104 cards are each numbered from 1-104 and have a specific number of “bullheads” or point values attached to them. The goal of the game is to finish with the least number of bullheads. In this paper, we examine different strategies that the participants developed to acquire the least number of bullheads per game and the strategy’s effectiveness in multiple rounds of 6 Nimmt!. This experiment was conducted as a randomized, blind study to control for the participant’s knowledge of multiple strategies. Each player independently developed and implemented their own strategy. Ultimately, we found the best strategy to be one where the low numbered cards were played first and the high number cards last. This, in combination with targeting other players who were doing well, was the most effective strategy.
Introduction
Math is everywhere, from technology and art to the sciences. You can see math unfold even on the simplest of things such as a card game. For this research paper, we wanted to use what we learned in our Statistics class and apply it to a regular card game. From a selection of multiplayer games, we decided that 6 Nimmt! would be our study game. Once we were associated with the game mechanics and rules, we came up with individual strategies to compete against each other in random groups. We wanted to test how effective each of our various strategies was, so we randomly split into two groups of five players each week in order to see who was the most successful. Throughout the study, all ten of us recorded our data at the end of each game to determine who was the most successful.
Background
6 Nimmt! or Take 5 is a German card game designed for 2-10 players. It was originally created by Wolfgang Kramer in 1994 and published by Amigo Spiele (6 Nimmt!). The game has 104 cards, each numbered 1-104. The goal of the game is to end up with the least amount of picked up cards.
To begin, each player is given 10 shuffled cards, then four are randomly placed face up in a vertical row. During each round, each player simultaneously reveals one of the numbered cards from their hand, which are then placed on the established row of cards in ascending order. The cards can only be played in a row where the last card has a lower value.
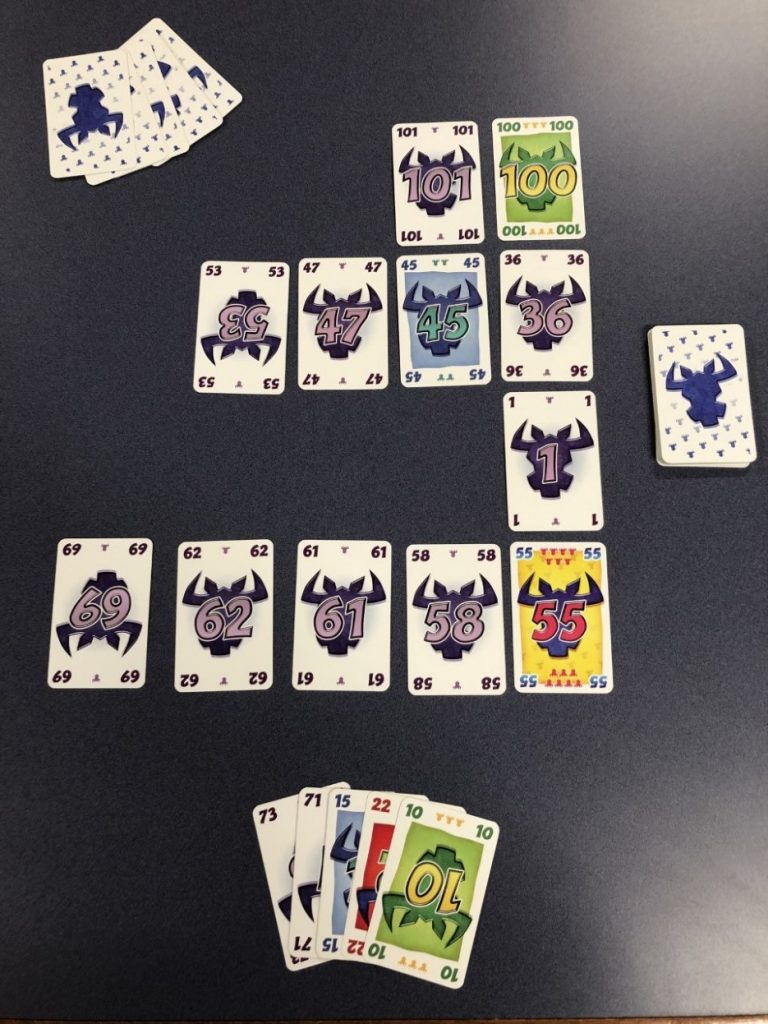
For example, if the four cards facing up were numbered 101, 53, 1, and 69, the person with the lowest number card—let’s say it is 10—would place their card next to the number 1 since 10 is a lower number than 53, 69, and 101. The cards are always played in a row that has the next lowest card.
There are two ways a player can pick up cards: by playing a number that is lower than all the top cards in the rows (the cards furthest to the right in the picture above), or if a sixth card is played in a row. If the sixth card is played, that person must pick up the five cards in the row and replace the first card with the last card played. If a player’s card is lower than the four top row cards, that player is allowed to choose which row to pick up and replace with their card. Every card that a player picks up is put to the side and will not be used in play. Furthermore, each card has a certain number of bullheads on it that are counted as penalty points at the end of each game. The player with the lowest number of bullheads wins.
Methods
We began our experiment by having each of the 10 players independently create a strategy that they believed would allow them to win. For disclosure the strategies were created based on games played before the experiment took place, each player playing the same number of games beforehand to eliminate any advantages. When we conducted our experiment, we divided the 10 players into two groups using a random number generator. Before each class session, we switched up the groups to collect the data with different individuals.
These distinct strategies were the foundation of our study since we were trying to determine which strategy was the most effective or if having a set strategy was necessary. Each player recorded their strategy and how they performed each game throughout testing. This included how many bullheads they ended the game with and if they won or lost. This data was utilized to analyze the success of each strategy through various metrics such as win rate, the number of bulls collected on average, the proportion of bulls compared to other players, and determining whether there was a superior strategy used to win the game. The strategies used can be placed in three main groups: those who started by playing all their higher cards first, those who started by playing their lower cards before their higher cards, and those who played their cards based on the cards already on the table.
The first strategy archetype was playing the lowest cards that the player had as early as possible. Though there were slight variations among these players, they all shared the common denominator that their small cards were used first. Andrew, Emily, Rolando, and Marcela all implemented this approach in their games. Their thought process behind this was to avoid having the lowest cards by the end of the game, which would almost always ensure at least one card being picked up. In doing this they attempted to avoid a problematic late game situation that could cost them a win. This is because a player must pick up cards when they are playing one that has a lower number than the rest of the cards in any row. Knowing this, they can strategically choose which stack with the lowest bulls. This strategy was effective, as these 4 players accounted for 12 out of the 20 wins. Marcela was the one notable exception among this group. Before the group began recording data, Marcela won multiple games. Unfortunately, these games are not recorded in our data and her data during testing was far different than beforehand. This can be explained by misfortune rather than an ineffective strategy, showing that there is indeed some luck involved while playing 6 Nimmt!.
While close to half of the players used lower cards in the early part of the game, two out of the ten participants instead played higher cards early in the game and saved their low cards for the end of the game. Abigail and Nathanael implemented playing higher cards early on because they wanted to avoid completing a row at the end of the game. This idea came from previous experience, obtaining rows in the late game, which did not happen as often when lower cards were played later. Both players thought that choosing the row that they would pick up was a better option than being forced into “taking five.” Both players that had this 6 Nimmt! philosophy combined for three wins and three ties were Abigail with 2 wins and 2 ties and Nathanael with 1 win and 1 tie, showing moderate effectiveness in avoiding bulls. These results came at the cost of never having a game where either player picked up zero bullheads.
The remaining group of players did not use the strategies of getting rid of the cards with the highest or lowest values first. Instead, these players decided to play their cards based on the cards already on the table. Stefan, for example, would play his cards based on what card was closest to the cards in his hand. Jose would get rid of outliers as soon as he was able to and then play close to the cards in his hand, allowing him to reduce the chance of having to pick up more cards later in the round. Aiden would focus on playing cards from her hand that were as close in number to the column she would play them on. The goal with this approach was to have as consistent a playable hand as possible. Lastly, Matthew was focused on playing cards that were close to the column they would be placed but also in columns that had as few cards as possible. He wanted to always play on a column that had two or fewer cards in order to avoid picking up. This group of players combined for the remaining 5 wins out of the 20 total, with 2 of the players in this group never achieving victory. This type of strategy was the most volatile and was heavily affected by luck, this being proven later by some of the group members having a “good” average amount of bullheads picked up but failing to win a game.
Five-Number Summary Results
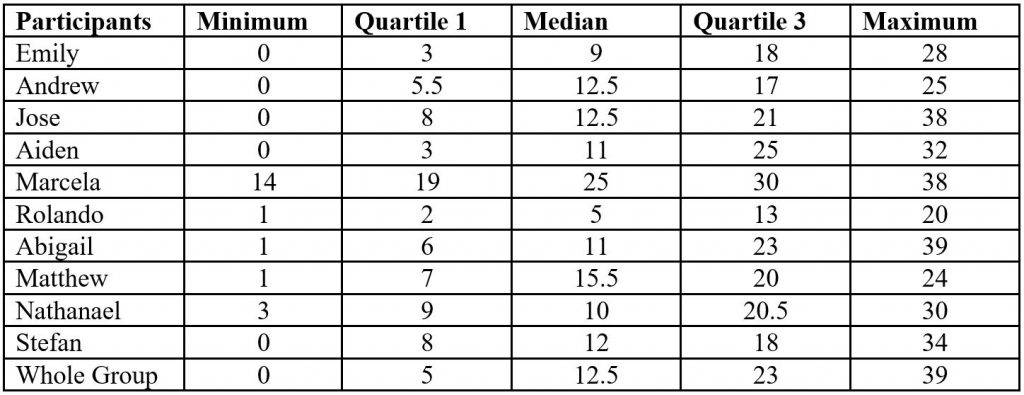
To determine the most efficient strategy, multiple tests were used including the Chi-Squared Goodness of Fit test and the five-number summary. The five-number summaries were calculated for all players. By entering the number of bulls received for one individual into the TI-84 calculator and then calculating the one-variable statistics, the mean, median, first quartile, and the third quartile were calculated. This was repeated for each individual and the group total so that we could determine if there were any outliers.
Interquartile Range (IQR) Results
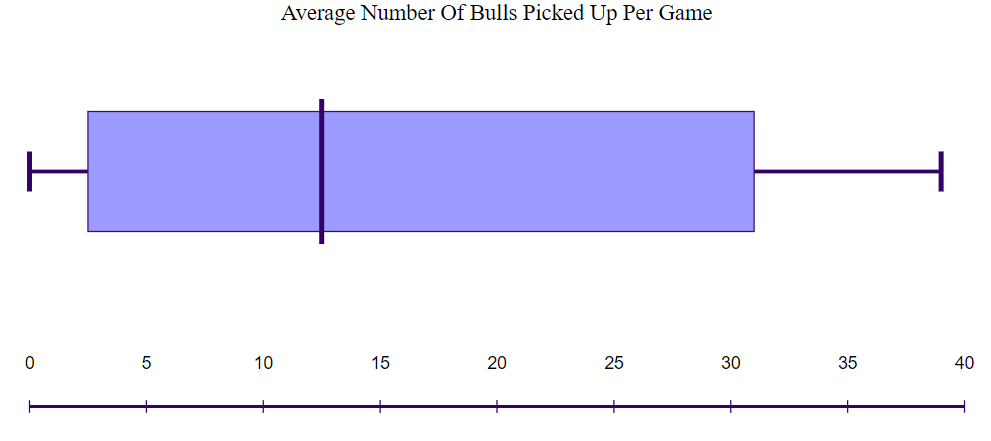
To calculate the outliers, the interquartile range (IQR) was needed. This was found by subtracting the third quartile from the first quartile. The upper fence was calculated by multiplying the IQR by 1.5 then adding the third quartile. The lower fence was found by once again multiplying 1.5 by the IQR, then subtracting that from the first quartile. These two numbers were used as the boundaries, and if a number was outside of the boundary, it was considered an outlier.
IQR: 18
Upper Fence: 50 Bulls
Lower Fence: 22 Bulls
While some players like Jose, Marcela, and Abigail had 38 or even 39 bulls picked up at most, they are not considered outliers. On the other hand, every player had at least 1 game where they picked up less than 22 bulls. According to the lower boundary they had outlier games. These “outlier” games mean that the player had a small number of bulls, indicating that they either won the game or they were close to winning the game. Players with more of these outlier games were also the ones who had a winning strategy. An example of this scenario is Rolando who had all 5 numbers under 22. He also won the most games individually with 6 and including ties with 7.
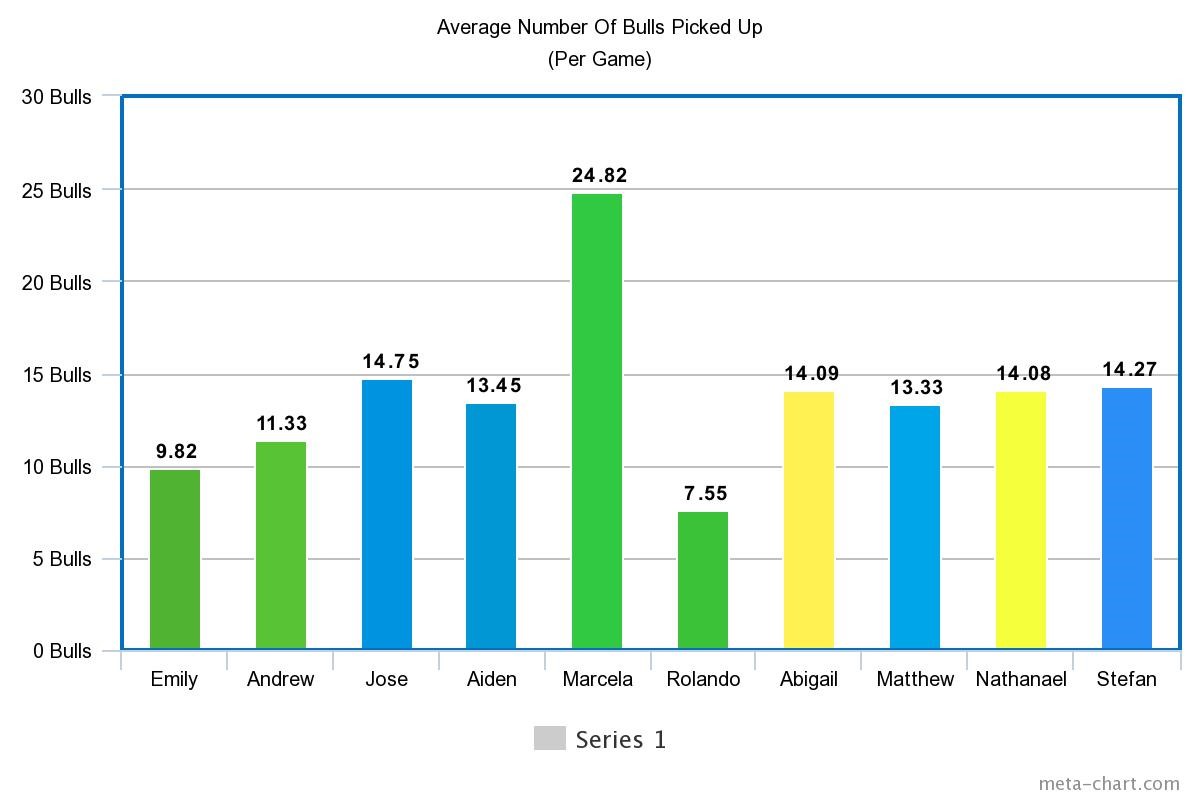
In our datasheet, we recorded the average number of bulls each player had at the end of each game. The minimum number of bulls on average was 7.55, and the maximum average number of bulls was 24.82. We found that the IQR of the data set was 2.94, and using that, we found the upper and lower fence to be 18.68 and 6.92, respectively. Only Marcela, who had an average number of 24.82 bulls, was outside of either the upper or lower fence. All other players were within the upper and lower fences. While all of the players other than Marcela were within the upper and lower fence, the group of players that played low cards first generally did better as you can see by the green group in Figure 3. Both of the remaining groups fell within the upper and lower fences and had an average that was considered “average”.
Chi-Squared Goodness of Fit Test Results
The Chi-Squared Goodness of Fit test is calculated by totaling the number of bulls an individual received at the end of a round and then using those sums to run calculations. Because there were 10 individuals, the sample size used is 10. Each data point was entered into a TI-84 calculator to calculate the test. From the various options available to us, we decided to use the Chi-Squared Goodness of Fit test as it would provide us with necessary information about the success of each strategy.
The null hypothesis for the Chi-Squared Goodness of Fit test was that each person had a uniform number of wins and ties. The alternative hypothesis for the Chi-Squared Goodness of Fit test was that at least one method received a greater average number of wins and ties than any other method.
[latex]\chi^{2}-\text{GOF test}[/latex]
[latex]\chi^{2}=14[/latex] [latex]p=0.1223\text{ Including ties}[/latex]
[latex]\chi^{2}=16[/latex] [latex]p=0.0669\text{ Not including ties}[/latex]
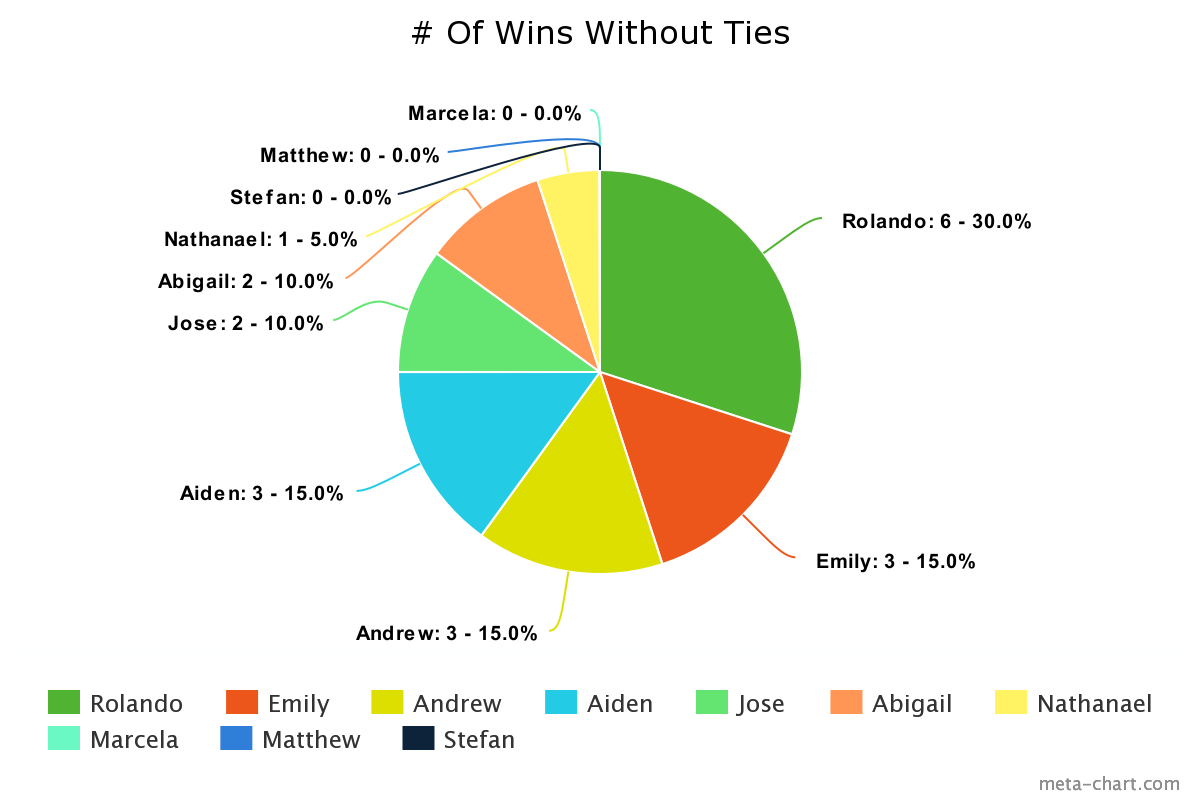
Not including ties, we only recorded 20 individual wins which is 4 short of what we originally expected. This means that in our expected win percentage model, each participant would have won 2 games each not including ties.Out of the 24 games played, the expected win rate per person (including ties) was 0.1, or 10 percent. This would mean that we would expect each participant to win 2.4 times total out of the 24 games that we played.
In Figure 4 below, both Abigail and Jose met this requirement by getting 2 wins each.
The other 8 participants were split evenly between having an above average amount of wins or having a below average total. Aiden, Andrew, and Emily won 3 games each with each player winning 15 percent of total games and the only outlier within this group was Rolando who doubled their win totals by winning 6 games which was 30 percent of the total wins. Nathanael, Marcela, Matthew, and Stefan combined for a total of 1 win. This group of participants who accounted for 40 percent of the players only won 5 percent of the games individually.
Using this data, we can conclude that the 4 players who had an above average win rate had an effective strategy for winning 6 Nimmt! games. The p-value with ties is 0.1223, and the p-value without ties is 0.0669. When the ties are not counted, this p-value is close to being unusual, under 0.05, and this aids in the conclusion that the 4 players had a repeatable, winning strategy.
While recording the data from our games we realized that we recorded 10 ties alongside the 20 wins. By the time we were compiling the data, our group decided to separate the wins from the ties but also count the ties as wins.
Each tie occurred because 2 or more players ended the game with the same number of bulls. Sometimes there were 3- or 4-way ties which led to there being more wins shared among the group than games that were played and recorded.
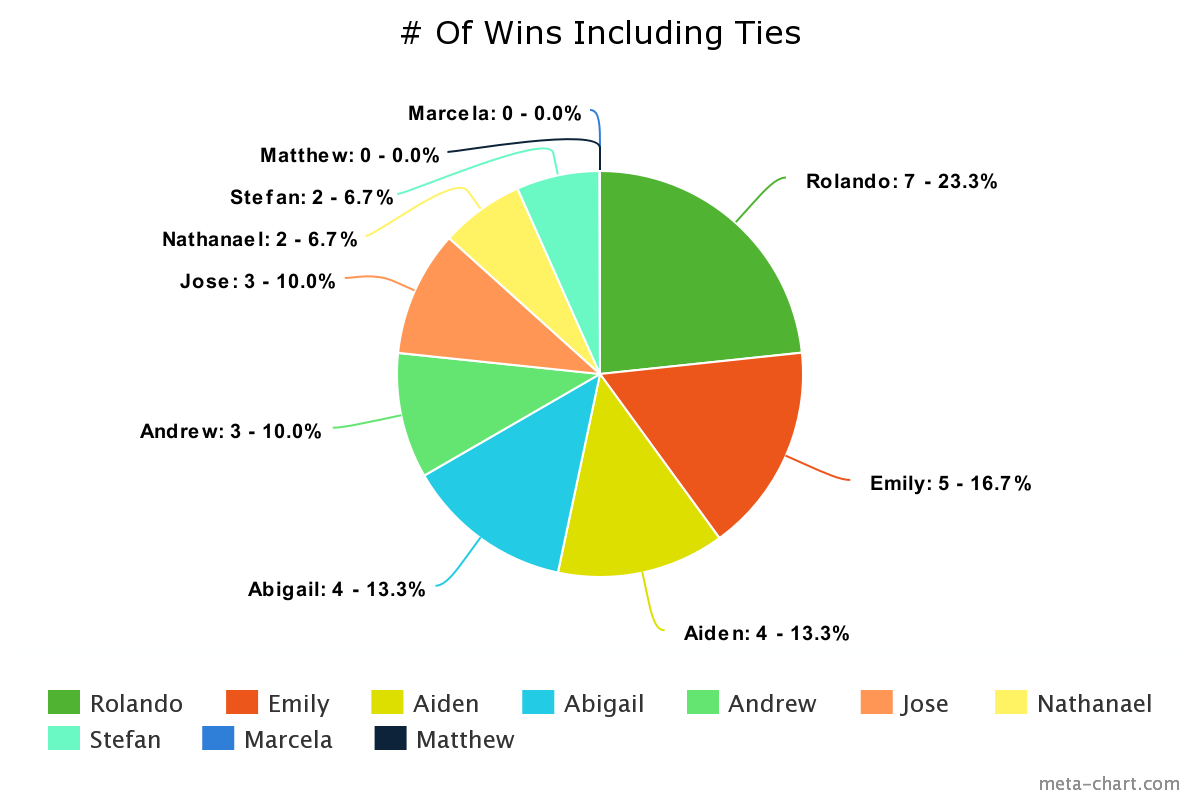
Unlike the individual wins, the results from the win totals including ties were less extreme than the total number of wins without ties. Previously a player only needed 2 wins to meet the expectations of an average winning strategy. When ties were included in the results, a player needed to win 3 games in order to meet expectations.
The players with effective, non-effective, and average strategies mostly stayed the same except for Abigail and Andrew. Abigail, who had 2 ties, doubled her total wins, and was placed in the higher group while Andrew, who did not have any ties, had the average number of wins. This made it so Andrew and Jose both had 3 wins total and had the expected number of wins. Just like the win totals without ties, 4 players had an above average amount of wins and 4 players had a below average amount of wins by the end of the 24 games.
Rolando, Emily, Aiden, and Abigail all won more than 3 games and made up 20 out of the 30 wins that were earned. This time Rolando had 7 wins total, and he had an average win rate of 0.583. While only having 2 more wins than the runner up (Emily) and 1 more win than he did without ties, Rolando won 58.3 percent of the games he played in with ties included versus only winning 50 percent of games without ties recorded.
This time the below average group quadrupled their win totals with a total of 4 wins out of 30. This was accomplished by Nathanael having a tie and Stefan having 2 ties. The unlucky players were Matthew and Marcela who unfortunately could not get a win with ties included. The below average group went from having only 5 percent of total wins to 13 percent with ties included.
Conclusion
Which strategy was the best?
The most effective strategy over the period of the 24 matches was Rolando’s. With a total of 6 victories and 1 draw, he had an average of 7.55 bullheads. In his strategy, he played lower cards earlier in the game and saved the higher cards for the end, carefully analyzing the playing field and cards in hand. He tried to bring down his opponents and didn’t give up a chance to be at the top. Based on our data analysis, Rolando’s strategy was statistically the most effective.
While the other types of strategies were capable of winning games for each player, the best type of strategy was to play lower numbered cards at the beginning of the game.
Is the use of a strategy always effective?
In bullheads, the most significant difference was between Rolando and Marcela. Both players had the same type of strategy, but Rolando had an average of 7.55 bullheads overall, while Marcela had an average of 24.82. Even though having this type of strategy was proven to be the most effective, there was a portion of luck involved in each round of 6 Nimmt! played. The rest of the participants averaged between 9 and 15 bullheads, which was found to be the average range of bullheads picked up each round. While the group of players with the low to high strategy won more, one can claim that luck played some role in the misfortune of the other players.
Our study concludes that playing lower cards earlier in the game leads to more victories. Overall, it was Rolando’s strategy that emerged victoriously among the participants. Although his strategy was like other participants, it is necessary to note that outside factors like luck and the random shuffling of the card deck can significantly change the results between rounds so it is not possible to calculate the effectiveness precisely.
For future studies, since our sample size only had ten subjects, we could add an additional control group and have an even number of people in each strategy group for more conclusive results. We could also add more total rounds played to increase the amount of data compiled. Additionally, we could apply the Chi-Squared Goodness of Fit test to other card games to calculate the effectiveness of their strategies to see if our testing method still applies in other settings.
Contact: jose.ayala@howardcc.edu, nathanael.bickel@howardcc.edu, andrew.bray@howardcc.edu, stefan.cehan@howardcc.edu, marcela.chicas@howardcc.edu, matthew.gries@howardcc.edu, rolando.huerta@howardcc.edu, aiden.pellegrino@howardcc.edu, abigail.pisanic@howardcc.edu, emily.snowberger@howardcc.edu, kehrhardt@howardcc.edu
References
[1] Hesse N. (2015) 6 Nimmt!. In: Spielend gewinnen. Springer Spektrum, Wiesbaden. https://doi.org/10.1007/978-3-658-04441-1_36
[2] “6 Nimmt!,” BoardGameGeek. [Online]. Available: https://boardgamegeek.com/boardgame /432/6-Nimmt!.
[3] William Navidi, Barry Monk. Elementary Statistics, 4th ed. https://www.mheducation.com/ home.html McGraw Hill, 2022
[4] “Graphing/Charting and General Data Visualization App.” Meta-Chart. https://www.meta-chart.com/