
3 Molecular Mechanisms for Circadian Rhythms in the Tobacco Hornworm (Manduca sexta)
Mary Green, Howard Community College
Jennifer Jun, Howard Community College
Mentored by: Ellena McCarthy, Ph.D. & Hannah Pie, Ph.D.
Abstract
The tobacco hornworm, Manduca sexta, notorious for its peculiar feeding behaviors toward the plant family Solanaceae, is known to the agricultural world as a pest. The exact reasoning behind this voracious feeding preference of Solenaceae is currently unknown. However, the molecular mechanism of circadian rhythms has been found to effect feeding behaviors in a multitude of organisms. Recent research has discovered tissue within the antennae of the adult Manduca sexta containing period (per) gene expression, a gene associated with circadian rhythms. Therefore, we will investigate the per gene and quantify its expression at two different larval stages, just-hatched and 5th instar larvae. In this experiment, primers were designed to amplify the per gene in Manduca sexta. Our research utilized PCR and qPCR to analyze the presence and quantify the expression of the per gene. The products of PCR were analyzed using agarose gel electrophoresis and the quality of the qPCR results was verified via melting curve analysis. Our designed primers successfully amplified the intended per gene product. The qPCR results using our designed per primers suggest that the per gene is expressed in both the just-hatched larvae and the 5th instar larvae. These data will allow us to design further studies to tease out whether circadian rhythms affect feeding behavior in Manduca sexta.
Introduction
In agriculture, the tobacco hornworm, Manduca sexta, has been viewed as a pest. By studying the tobacco hornworm, we can better understand the behavior of the insect to help farmers potentially increase the yield of their crops. Manduca sexta is a hawkmoth larva included [1] in the Sphingidae moth subfamily. Within three months of hatching, Manduca sexta completes 5 instar larvae phases [2], a pupae phase, and transitions into an adult hawkmoth. The tobacco hornworm is particularly known for its specific feeding preference [1] of Solanaceae plants. Since the Solanaceae family includes prevalent crops such as tomatoes, potatoes, and bell peppers, the Manduca sexta’s feeding preferences can be problematic to agriculturists. The tobacco hornworm is considered a pest for consuming such prominent crops. Recent studies have been completed to determine the mechanisms behind the tobacco hornworm’s feeding preferences and behavior.
A circadian rhythm [3] is a natural 24-hour cycle with which an organism bases its daily sleep-wake cycle. Many organisms have developed these circadian rhythms, which are endogenous mechanisms for keeping time. Circadian rhythms can play a role in regulating behavioral rhythms, development, and endocrine activity [4]. Circadian rhythms have been seen in different model organisms. For example, a recent study [5] has indicated that a change of diet in the common house mouse alters the natural circadian clock. The addition of a high fat diet, a change in the natural feeding behavior, directly impacted the rhythm’s cycle. This suggests a direct correlation between circadian rhythms and feeding behavior. One of the genes involved in this timekeeping mechanism is the period (per) gene [6].
Through experiments using the fruit fly, Drosophila melanogaster, the per gene has been shown to be transcriptionally regulated, which is reflected in the levels of Per mRNA transcribed from the per gene [7]. The Period (PER) protein acts as a transcriptional repressor to the per gene and plays an important role in a negative feedback loop. The PER protein represses its own transcription by blocking the transcription factors, CLOCK and CYCLE [8]. In the negative feedback loop, the PER protein builds up during the night. The cycling of Per mRNA and PER protein levels are critical for helping set the circadian oscillators to light – dark cycles. Per mRNA levels have been shown to be at their highest during the lights-off portion of the light-dark cycle [9]. An enhancer has been located upstream of the per gene sequence. Under light-dark cycles or continual darkness, the enhancer will help produce high levels of Per mRNA cycling. Currently, it remains unknown whether the caterpillars have a rhythm of per expression as well as if this rhythm translates to a behavioral rhythm [6].
Recent studies with the insect Gryllus bimaculatus [10] and the adult Manduca sexta [11] support the finding of per gene and circadian rhythms linkage in insects. For example, one study discovered a potential circadian rhythm clock located in the optic lobe Per mRNA patterns of the Gryllus bimaculatus [10]. The experiment altered production of per during the final nymph instar phase of the Gryllus bimaculatus. This was done through RNA interference (RNAi) by injecting double-stranded RNA into the abdomen of Gryllus bimaculatus to disrupt the PER production. After 50 days of complete darkness, the injected Gryllus bimaculatus experienced disrupted circadian rhythm clock patterns; whereas, the control group experienced no change in their day-night cycle. The experiment concluded that per was vital to the role of circadian rhythms in the Gryllus bimaculatus nymphs. Another study [11] discovered the expression of the per gene in the antennae of the adult hawkmoth Manduca sexta. After noticing patterns similar to circadian rhythms in the antennae, the researchers identified the PER protein in the Manduca sexta antennae. Overall, the experiment concluded that there was strong evidence of circadian rhythms in the adult Manduca sexta’s antennae.
We suggest that the per gene’s connection with circadian rhythms could be a potential link to understanding the Manduca sexta’s feeding behavior. Our study will be examining whether the per gene is expressed within Manduca sexta during the just-hatched and 5th instar larval stages. A common method used to measure the expression, or amount of mRNA being transcribed from a gene, is through quantitative polymerase chain reaction (qPCR). qPCR utilizes cDNA made from the reverse transcription of extracted RNA to create a DNA strand to amplify in order to quantify expression of a given gene. This research will utilize reverse transcription and qPCR to quantify the expression and presence of the per gene in the Manduca sexta 5th instar and just-hatched larvae. We hypothesize since Per mRNA is present in the adult hawkmoth it will be also expressed within the just-hatched and 5th instar larvae.
Methods Overview
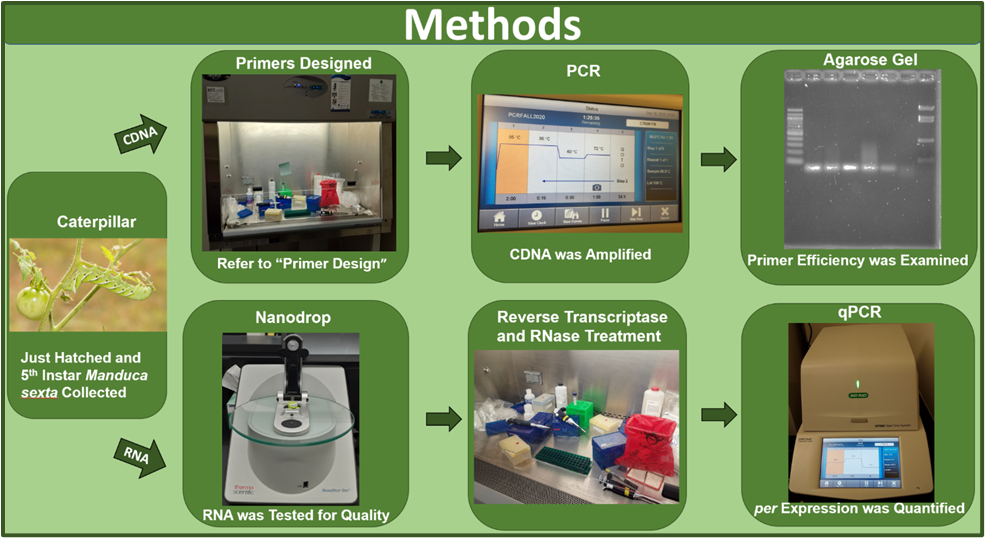
In this experiment, primers specific to the per gene were designed and were then tested for accuracy. Once primer accuracy was established through polymerase chain reaction (PCR) and agarose gel electrophoresis, the primers were used for qPCR to quantify per gene expression within the 5th instar larvae and just-hatched caterpillar samples of the Manduca sexta (Figure 1). The 5th instar caterpillars were received from Dr. Gretes’ research group after the completion of the feeding experiments and behavioral testing. Prior to the dissection, the 5th instar caterpillars were anesthetized for at least 15 minutes using an ice bath. Between collection of each sample, the dissecting equipment was cleansed with RNase Zap and 95% ethanol to avoid contamination. In addition to cleansing equipment, all pipetting occurred within a fume hood to limit potential contamination.
Primer Design
Using the NCBI Blast tool, primers were selected for use with the Actin housekeeping gene mRNA (GenBank: L13764.1) and the Per mRNA (GenBank: U12773.1). Further analysis was conducted using the IDT Oligo Analyzer tool leading to the selection of two primers within our primer requirements (Table 1). To ensure primer specificity to the per gene, the primers selected had to qualify under the conditions of 70-200bp in length and an ideal max delta G above -6 kcal/mol in the self-dimer. The primer also had to exhibit an ideal melting temperature of 60 ± 2℃ to avoid melting before the completion of the annealing process. Additionally, each potential primer was examined for repeating bases and possible hairpin loops, which would inhibit proper binding. Furthermore, primers needed to contain at least 2, but no more than 3 guanine or cytosine in the last 5 nucleotides on the 3’ end for a proper guanine/cytosine clamp. The accuracy of both primers were analyzed and determined using polymerase chain reaction (PCR) and agarose gel electrophoresis. The PCR process was completed by creating separate master mixes of the PCR SuperMix (Thermo Fisher) and the forward and reverse primers for each set of primers in Table 1. The actin primers were utilized as a reference [12]. To each reaction tube, 24 µL of the primer set specific master mix and 1.5 µL of isolated cDNA samples from the Manduca sexta larvae was added. For this test, four different 5th instar larvae and one just-hatched larvae were examined. For the negative no template (NT) control, 1uL of water was applied to the sample tube in place of the cDNA. The PCR was conducted with the first step at 95℃ for 2 minutes for polymerase activation and DNA denaturation. Subsequently, 35 cycles were run with 15 seconds at 95℃ for denaturation, 30 seconds of annealing at 60℃, and then 1 minute of extension at 72℃. After PCR, 2µL of 6x purple loading dye (New England Biolabs) was added to each PCR reaction sample. Each sample was loaded onto a 2% agarose gel and electrophoresed at 125 volts for 25 minutes. In order to examine the size of the PCR fragments, a 100bp ladder and a pBR322-BstNI ladder (New England Biolabs) were also run with the samples. In order to visualize the bands, the gel was incubated in 1X TAE buffer with ethidium bromide. The ladders applied were then utilized to size the sample bands and analyze primer accuracy.
| Gene and Product Length | Primer Sequence | Melting Temperature (℃) |
|
period (per) Set 1 73 bp |
F 5′ CCAAGGAGCAGAAGTACAGGAG 3′
R 5′ GCTACCTCAGCGGGTTTAGT 3′ |
60.09
59.46
|
|
period (per) Set 2 173 bp |
F 5′ CCGTCTAATCCCGACGTGTT 3′
R 5’ TCTTGGCATCGCTTGGTCAT 3’ |
59.83
60.04
|
|
actin control 190 bp |
F 5’ CGTGCCCATCTACGAAGGTT 3’
R 5’ CTGCTCGAAGTCAAGAGCGA 3’ |
60.11
60.11 |
RNA Extraction
Prior to conducting qPCR with the designed primers, RNA was extracted from tissue samples of five 5th instar caterpillars with varying diets. Tissue samples were collected from the head and intestinal tract (gut) of the 5th instar caterpillars. Additionally, RNA samples were extracted from whole, just-hatched caterpillars. All tissue or whole larvae samples were preserved in 500 µL of RNAlater to prevent the degradation of RNA and kept at a constant temperature of 4 °C overnight and then at -80°C until use. Tissues preserved in RNAlater were removed from that solution and placed into 600 µL of RTL buffer containing 39.2 mM dithiothreitol (DTT). For homogenization, a battery operated hand-held homogenizer and pestle were used to disrupt the tissue and whole caterpillar samples. A RNeasy Plus Mini RNA extraction kit (Qiagen) protocol was utilized for the RNA extraction process [13]. Exceptions from the standard kit protocol include addition of DTT to the RTL buffer to promote complete lysing of cells and use of 600µL of RTL buffer due to the quantity of tissue assayed.
Additionally, a second centrifuge spin was conducted prior to elution of RNA from the column to ensure the removal of as much ethanol as possible before elution. Afterwards, the Nano Drop was utilized to test the RNA samples for purity. This was accomplished by comparing the samples to the standard A260/230 and A260/280 levels of pure RNA, which stand at 2.0-2.2 and ~2.0 respectively. Only samples with RNA within these ratios were utilized for further analysis.
cDNA Synthesis
Using the extracted RNA, cDNA was synthesized following the protocols of the RevertAid First Strand cDNA Synthesis Kit (Thermo Fisher). A master-mix was created using nuclease free water, Oligo (dT)18 Primer, 5x RNase Inhibitor, and 10 mM dNTP mix. To each reaction tube, 2 µL of template RNA from the different caterpillar samples, 1 µL Revert Aid M-MuLV Reverse Transcriptase, and 17 µL of master-mix were added. In order to synthesize the cDNA, reverse transcriptase was added to each sample. A negative control was conducted using a no reverse transcriptase (no RT) sample. A positive control was conducted with the Gapdh RNA provide by the kit. The reaction tubes were then placed in the Thermocycler following the recommended protocols from the kit. After the completion of the cDNA synthesis, the samples were treated with RNase H to remove any residual RNA leaving only the synthesized cDNA. RNase treatment was conducted by adding 1uL, or 2 U concentration, of ribonuclease H (RNase H) into each cDNA synthesis reaction tube. Afterwards, each tube was incubated at 37°C for 20 minutes. The efficiency of the RNase H treatment was determined using the qPCR results of the negative no RT control.
qPCR Process
To conduct qPCR, a master-mix was created using RNase free water, our designed forward and reverse primers, and SYBR green mix following the SsoAdvanced™ Universal SYBR® Green Supermix (Bio-Rad) kit parameters. The cDNA samples collected were used in the qPCR process to measure expression of per and actin genes in the 5th instar larvae and just-hatched caterpillars. White, 8-well test strips with clear caps were used for the qPCR process. 19 uL of master mix was pipetted into every well. Then, 1uL of each collected cDNA sample was placed into respected wells. All samples were done in triplicate. Following standard procedure, the qPCR program was comprised of 40 cycles, which was optimal for tracking actin and the potential per expression. The qPCR was conducted with the first step at 95℃ for 30 seconds for polymerase activation and DNA denaturation. Subsequently, the 40 cycles were run with 15 seconds at 95℃ for denaturation and then 30 seconds of annealing at 60℃. The melting curve spanned from 65℃ to 95℃ at 0.5℃ increments every 5 seconds. For the negative no template (NT) control, 1uL of water was applied to the master-mix well in place of the cDNA. For our positive control, gapdh was implemented to determine whether the qPCR procedure was functioning properly. Additionally, the actin gene was utilized as a reference to the measured per expression.
Results
Primer Validation Results
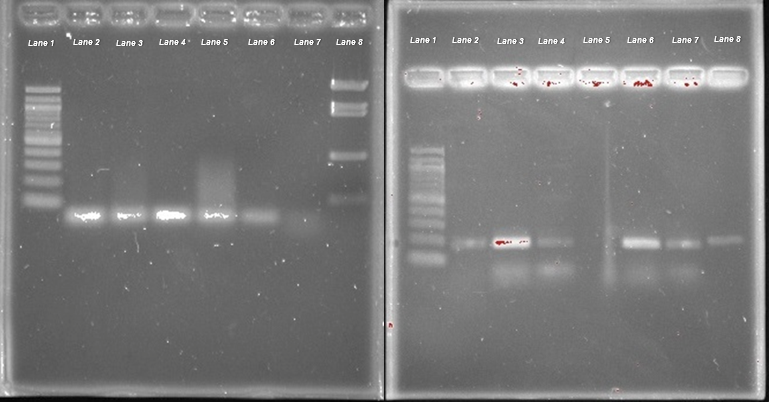
Agarose gel electrophoresis was utilized to determine the length of the primer bands; therefore, the accuracy of the designed primers. Figure 2 displays the separate agarose gel runs to test the accuracy of primer 1 and 2, respectively. A 100 base pair (bp) ladder and a pBR322-BstNI digest ladder were the molecular weight ladders used to approximate the resulting gel bands. The gel results indicated that primer 1 would be a better choice compared to primer 2. Primer 1 produced the expected single band of 73 bp approximately just below the 100 bp band indicated by the molecular weight ladder. Primer 2 produced an unexpected band in addition to the expected band of 173 bp just below the 200 bp band of the 100 bp ladder. The unexpected band may have resulted from possible contamination or complementarity sequence to another gene sequence within Manduca sexta. Primer 1 was chosen to complete the experiment as its specificity was most accurate to the per gene.
qPCR Results
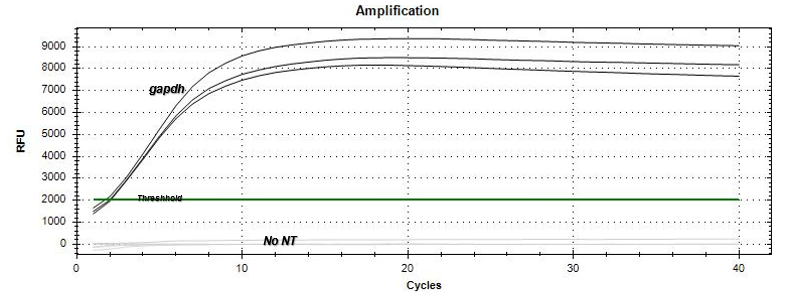
Based on the amplification curves, there was expression of the per gene by the just-hatched caterpillars as well as the 5th instar tobacco hornworm larvae. The qPCR results
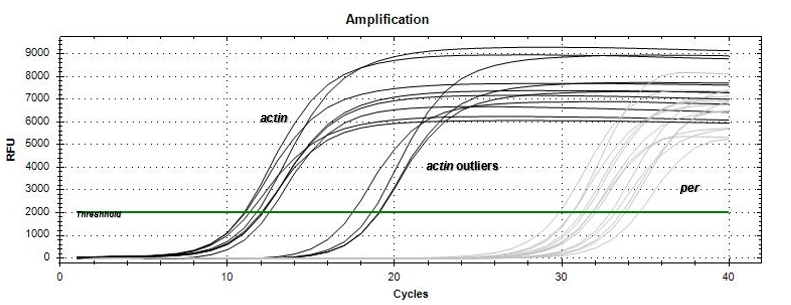
(Figure 3) demonstrated that the no-template (NT) negative control did not express an amplification curve throughout the qPCR run, indicating no contamination occurred within the master-mix. In addition, the gapdh positive control appeared as the first amplification curve beginning to increase exponentially at the 2 cycle mark. The positive control was followed by the actin reference gene (Figure 4) appearing mostly between the 10-12 cycle marks with a few samples exponentially increasing in amplification between 18-20 cycle marks. The per gene 5th instar samples appeared last on the qPCR data graph (Figure 4) between the 28-32 cycle marks. The just-hatched caterpillar samples appeared to show expression on the qPCR data graph; however, the amplification curves were not consistent in cycle number.
Conclusions and Future Plans
Manduca sexta is a voracious eater of the plant family Solanaceae. The agricultural community would benefit from a better understanding of the Manduca sexta’s peculiar feeding preferences. Prior to conducting this experiment, we hypothesized that the per gene would be expressed within the 5th instar and just-hatched Manduca sexta larvae due to its expression in the adult hawkmoth shown in previous experiments [11]. Our data collected through the qPCR process examined the expression of per within the 5th instar and just-hatched larvae in relation to the actin reference gene.
Our qPCR results graph appeared to establish expression of per within the 5th instar and just-hatched Manduca sexta. This was displayed through the amplification curve of the per gene, which would imitate the NT negative control if per was not expressed within the Manduca sexta genome. In reference to actin, the per amplification curve appears at a later cycle mark to the reference gene indicating that per is expressed in the 5th instar caterpillars less than actin. Interestingly, the actin results have a few outliers which displayed an amplification curve at a later cycle range from where most actin samples appeared. The cause of the outliers could potentially be traced to the differentiation in diet of the 5th instar larvae samples. However, the sample size of the 5th instar caterpillars with the outlier diet was not large enough to determine any correlation between diet variance and actin expression. The just-hatched caterpillar samples were all shown to have amplification curves for per, and therefore seem to exhibit expression. However, the amplification curves were not consistent in cycle number; therefore, the quantification at which this gene expression occurred in relation to the actin reference gene or the 5th instar per expression could not be determined. Based on our data, the period gene appears to be expressed during 5th instar and just-hatched stages of the Manduca sexta larval time frame. Overall, the qPCR results support the hypothesis made prior to conducting the experiment.
These results are similar to experiments [14] conducted using the cotton leafworm caterpillar, Spodoptera littoralis, as the model organism. This study found that the cotton leafworm caterpillar’s feeding and metabolism was regulated by circadian rhythms. Our results correspond to the above study as per, a gene associated with circadian rhythms, appeared to be expressed within the Manduca sexta larvae. As these circadian rhythms can be related to feeding behaviors, our experimental results could be utilized to explore a potential relationship between the molecular clock and peculiar feeding preferences of the Manduca sexta. Overall, the results of this research can be applied to the agriculture community to prevent loss of future solanaceous crops. Future experiments can explore this relationship using behavioral testing with the tobacco hornworm. Additionally, experiments can also examine whether the feeding behavior of the tobacco hornworm is constitutively or rhythmically regulated. For example, an additional experiment could examine the expression of the period gene and the sleep-wake cycles of the tobacco hornworm. Furthermore, an experiment conducted with increased sample size may be able to provide meaningful and conclusive data about the relationship between feeding preferences and circadian rhythms of the tobacco hornworm.
Acknowledgements
Thank you to the funders of the Kahlert Foundation, for helping support Howard Community College’s Undergraduate Research in Science program (URSC) and students. Also, to Dr. Gretes’s research team for providing the caterpillars used in this experiment. Additionally, thank you to Dr. Jones, for preparing us to conduct our scientific research.
Contacts: mary.green2@howardcc.edu, jennifer.jun@howardcc.edu, emccarthy@howardcc.edu, hpie@howardcc.edu
References
[1] R. Kanost et al. “Multifaceted biological insights from a draft genome sequence of the tobacco hornworm moth, Manduca sexta”, Insect Biochemistry and Molecular Biology, vol. 76, pp. 118-147, Sep. 2016, doi: https://doi.org/10.1016/j.ibmb.2016.07.005.
[2] H. Nijhout, “A Threshold size for metamorphosis in the tobacco hornworm, Manduca sexta.”, The Biological Bulletin, vol. 129, no. 1, Aug. 1975, doi: https://doi.org/10.2307/1540491.
[3] Hao, D. L. Allen, and P.E. Hardin, “A Circadian Enhancer Mediates PER – Dependent mRNA Cycling in Drosophila melanogaster,” Journal of Molecular and Cellular Biology, vol. 17, no. 7, pp. 3687-3693, Jul. 1997, doi: 10,1128/mcb.17.7.9687.
[4] Patke, A., Young, M.W. & Axelrod, S. “Molecular mechanisms and physiological importance of circadian rhythms.”, Nat Rev Mol Cell Biol, 21, 67–84, (2020). doi: https://doi.org/10.1038/s41580-019-0179-2.
[5] Kohsaka et al. “High-fat diet disrupts behavioral and molecular circadian rhythms in mice”, Cell Metabolism, vol. 6, no. 5, pp. 414-421, Nov. 2007, doi:https://doi.org/10.1016/j.cmet.2007.09.006.
[6] Niepoth, G. Ke, J. C. de Roode, and A. T. Groot, “Comparing Behavior and Clock Gene Expression between Caterpillars, Butterflies, and Moths,” Journal of Biological Rhythms, vol. 33, no. 1, pp. 52-64, Feb. 2018, doi: 10,1177/0748730417746458.
[7] E. Hardin, J. C. Hall, and M. Rosbash, “Circadian oscillations in period gene mRNA levels are transcriptionally regulated,” Proceedings of the National Academy of Science, vol. 89, no. 24, pp.11711-11715, Dec. 1992, doi: 10,1073/pnas.89.24.11711.
[8] Grima, et al., “PERIOD – controlled deadenylation of the timeless transcript in the Drosophila circadian clock,” Proceedings of the National Academy of Science, vol. 116. no.12, pp. 5721-5726, Mar. 2019, doi:10.1073/pnas.1814418116.
[9] Qui and P. E. Hardin, “per mRNA Cycling is Locked to Lights-Off under Photoperiodic Conditions That Support Circadian Feedback Loop Function,” Journal of Molecular and Cellular Biology, vol. 16. no. 8, pp. 4182- 4188, Aug. 1996, doi: 10.1128/mcb.16.8.4182.
[10] Moriyama, T. Sakamoto, S. G. Karpova, A. Matsumoto, S. Noji, K. Tomioka, “RNA interference of the clock gene period disrupts circadian rhythms in the cricket gryllus bimaculatus.”, Journal of Biological Rhythms, vol. 23, no. 4, pp. 308-318, Aug. 2008, doi: https://doi.org/10.1177/0748730408320486.
[11] Schuckel, J., Siwicki, K.K. & Stengl, M. “Putative circadian pacemaker cells in the antenna of the hawkmoth Manduca sexta,”. Cell Tissue Res, 271–278, Sep. 2007, doi: https://doi.org/10.1007/s00441-007-0471-x.
[12] Archampong, A., Arminio, M., Bucksell, J., Deljookorani, S., & Teferedegn, B. “Neuropeptide F mRNA Expression in the Tobacco Hornworm,” Journal of Research in Progress, vol. 2, pp. 12-19, 2019.
[13] Qiagen, “RNeasy® plus mini handbook.”, Qiagen, 2020. file:///C:/Users/MARYGR~1/AppData/Local/Temp/HB-0405-004_HB_RNY_Plus_0120_WW%20(1).pdf.
[14] Suszczynska, M. M. Kaniewska, P. Bebas, J. M. Giebultowicz, and J. Kotwica,– Rolinska, “Circadian regulation of caterpillar feeding and growth,” Journal of Insect Physiology, vol. 101, pp. 113-122, Aug. 2017, doi: 10.1016/j.jinsphys.2017.07.009.
