
1 Surface Water Quality for Copper and Manganese Around the HCC Campus
Vincent Carmody, Howard Community College
Tuan Mai, Howard Community College
Mentored by: Hannah Pie, Ph.D. and Rebecca Carmody, Ph.D.
Abstract
Water pollution is a serious issue that requires constant attention. In the Columbia area of Howard County, this problem requires frequent monitoring because surface water flows into reservoirs where drinking water is obtained. In this study, concentrations of copper (Cu) and manganese (Mn) were determined in surface waters around Howard Community College (HCC) in order to determine whether the levels are above or below the EPA drinking water limits. Campus surface water was collected at four locations, processed, and then analyzed using an atomic absorption spectrophotometer. As concentrations of these metals were unknown in Howard County, preliminary work was needed to determine the appropriate methods for analysis. The results of our analysis indicate that the graphite furnace should be used because of the low metal concentrations in the surface waters.
The Cu concentrations in our samples ranged from below detection limit to 9.18 μg/L, with the highest concentration being detected in the early spring pond sample. The Mn concentrations in our samples ranged from 1.90 to 766 μg/L, with the highest concentrations being detected in the early spring samples. This suggests a contribution of Mn due to increased leaching in the presence of road salt [1]. The greatest concentration of Cu was 9.18 μg/L, and the EPA limit for Cu is 1.3 ppm (1300 μg/L) [2]. The Cu concentrations in the surface water around the HCC campus are well below the EPA limit. However, the EPA limit for manganese is 50 μg/L [3], and our greatest concentration was 766 μg/L, approximately 15 times higher than the level the EPA considers safe for drinking water.
Introduction
Worldwide, water pollution is an alarming issue, with much of it due to human activities including manufacturing, agriculture, mining, and littering [4]. Environmental contamination of surface water is a major health concern because eventually the contaminants will get into the water supply. The contaminants, which can be either organic or inorganic, enter the surface water after a rainstorm, ice melting, or a flood. The majority of organic pollutants decompose over time, but inorganic trace heavy metals such as copper (Cu), manganese (Mn), zinc (Zn), nickel (Ni), and iron (Fe) cannot be degraded in the environment [4].
Heavy metals are major pollutants because of their toxicity and are a threat not only to humans, but to other living things [4]. Some heavy metals are essential to humans in small amounts, but in amounts exceeding EPA standards, they can cause health issues [2]. Even though Cu is an essential trace element, higher concentrations of Cu in humans have been shown to lead to gastrointestinal distress and can cause anemia and damage the kidneys and liver [4]. Moderate levels of Cu have also been shown to be toxic to plants and algae [4]. Mn is also an essential trace metal. While relatively non-toxic to animals, Mn can be toxic to plants at higher levels [4]. Both Cu and Mn can impact the taste of water and can cause economic loss from the staining of clothing and plumbing fixtures [4].
Recently, there have been a number of studies done of water contamination in the Mid-Atlantic States by the United States Geological Survey (USGS). These include studies of the ground water quality around the Anacostia River in Washington, D.C. [5] and southwest West Virginia [6]. Additionally, there is a USGS study of mercury in the nation’s streams [7], and studies by Moore et al. [8,9] of chloride (Cl), sodium (Na), calcium (Ca), bicarbonate (HCO3) and other ions in surface waters in Maryland and the eastern United States. Between the autumn of 2017 and the spring of 2019, Beckjord et al. [10] conducted a study of the water quality in a stream on the HCC campus. Sites A and B are the same stream studied by Beckjord et al. [10] although samples are collected at different locations on the stream. Beckjord et al. [10] analyzed nitrate, phosphate, chloride, conductivity, dissolved oxygen, and pH.
However, to our knowledge, no study has been done for copper and manganese in the surface water in Howard County, Maryland. Therefore, a goal of this project was to determine whether concentrations of these and other heavy metal ions are above the EPA standard limits. If the surface water has high concentrations of heavy metals, it could affect the health of animals and plants around the campus. People will not directly drink this water, but the water may eventually reach the source of water humans do drink. Establishing these levels allows for environmental solutions to be enacted by the proper authorities, if required.
The purpose of this research was to determine the concentrations levels of Cu and Mn in the surface water at four locations on the campus of Howard Community College (HCC) using Atomic Absorption (AA) spectrometry. Our samples were collected from two different stream systems on the HCC campus and at two collection points within each stream system (Figure 1).
Methods
Collection
Samples were collected on March 6, August 29, and October 12, 2020. The October 12 samples were collected between 1 and 2 hours after a heavy rain. Sites A and B are on the same stream with A being upstream from B (Figure 1). Site C is a large retention pond and site D is on a stream that feeds into this retention pond. The stream at sites A and B is topographically separate from the steam system where sites C and D are located (Figure 1).
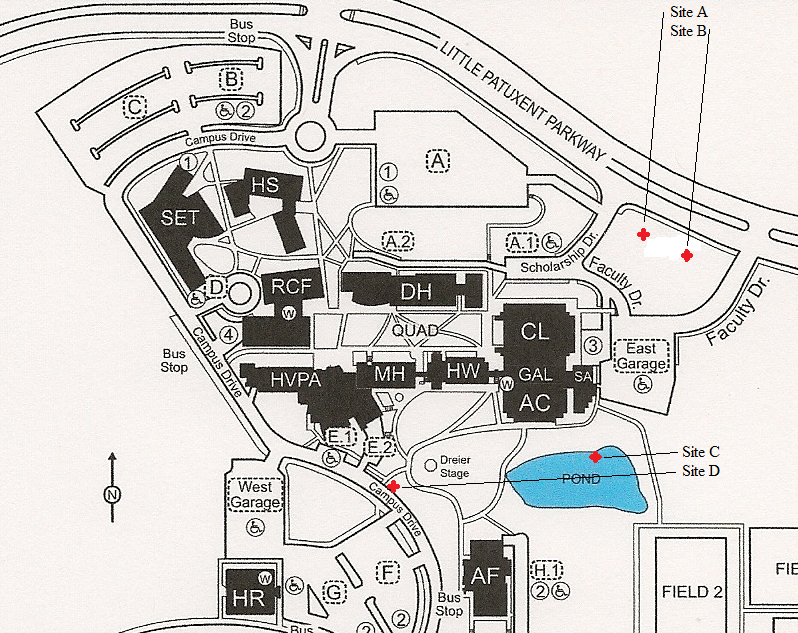
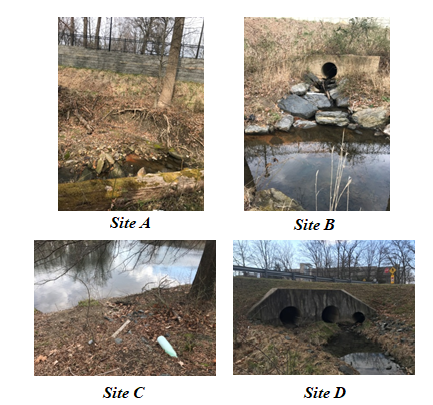
Sites B, C, and D have direct inputs from one or more culverts or a drainage pipe, while site A is 20-30 feet from a culvert in either direction (Figure 2). The surface run-off that contributes to the flow at sites A, C, and D primarily comes from campus, while additional surface run-off from north of the campus enters the stream at site B through a continuously flowing culvert (Figure 2).
Sample collection was performed wearing hip waders, with one set of waders for sites A and B and one set for sites C and D to minimize cross contamination. The same collection procedure was followed at each of our four sites. While wearing disposable gloves, a capped, 1-L high density polyethylene (HDPE) bottle was submerged in the water to a depth of 10 cm, opened, filled, and closed. On the October 12 sampling, another, smaller bottle was filled in the same way at each site in order to test water quality parameters shown in Table 2. Also on October 12, a LabQuest2 was used to determine the following data in the field: air temperature, water temperature, dissolved oxygen, atmospheric pressure, pH, and turbidity. Immediately after collection, all the samples were stored on ice at 4°C.
Filtering
Collection and filtering were always conducted on the same day to ensure that the samples were properly preserved. Prior to filtration of the water samples, a filter blank of 100 mL of 2% weight to volume (w/v) trace metal grade HNO3 was filtered through a 0.45 μm membrane filter (MilliporeSigma HAWP04700). The filter blank was stored in a 250 mL HDPE bottle. Then the water sample was filtered through the same membrane filter and stored in a 1 L HDPE bottle. After filtering, 2 mL of 70% weight to weight (w/w) trace metal grade HNO3 was added to the sample to ensure the pH was less than 2. These water samples and the filter blanks were stored at 4°C until analysis. All bottles, filter parts, and glassware were washed with lab detergent and water, triple rinsed in de-ionized (DI) water, soaked in 4% HNO3, triple-rinsed in DI water, and then dried in a drying oven.
Analysis
Analysis was performed using a Shimadzu model AA7000 spectrophotometer (AAS). Standards solutions were prepared by serial dilution of Mn and Cu stock solutions with initial concentrations of 1000 μg/mL purchased from Inorganic Ventures. Metal concentrations in the samples were determined using a graphite furnace (GFA-7000) with argon gas. A Mn hollow cathode lamp, with a wavelength of 279.5 nm, was used to measure the Mn concentrations and a Cu hollow cathode lamp, with a wavelength of 324.8 nm, was used to measure the Cu concentrations. 2% w/v trace metal grade HNO3 was analyzed at frequent intervals during sample runs, including between each unknown sample and after analysis of higher-concentration standard solutions, to avoid carry-over of metals from one sample or solution to another. One mL of standards, samples, and the filter blanks were put in 2 mL vials which were placed in the slots of the autosampler and run in triplicate with a fourth run added if one of the first three absorbance values deviated significantly from the others. These values were averaged to obtain our results.
A standard curve was determined for both Cu (Figure 3) and Mn (Figure 4) using a series of solutions spanning the concentration range of interest; these solutions were produced through the process of serial dilution. The concentrations used for the Cu calibration curve were 0.8, 2.4, 4.0, 6.0 and 10 μg/L. For Mn, the concentrations were 0.5, 2.0, 10, 25, 50, and 100 μg/L. Absorbance values for solutions with these known concentrations were determined using the atomic absorption spectrophotometer. Then scatter plots (Figures 3 and 4) were created by graphing the absorbance (y-axis) versus the concentration (x-axis). The ranges of concentrations used ideally produce a linear relationship to absorbance following Beer’s Law. The standard error values for the triplicate measurements of each standard concentration ranged from 0.00049 to 0.0010 absorbance units for Cu and 0.0010 to 0.021 for Mn (Figures 3 and 4).
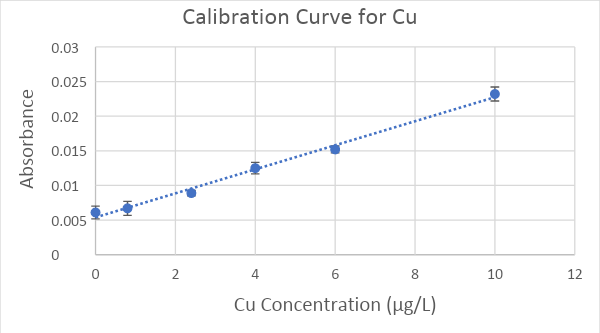
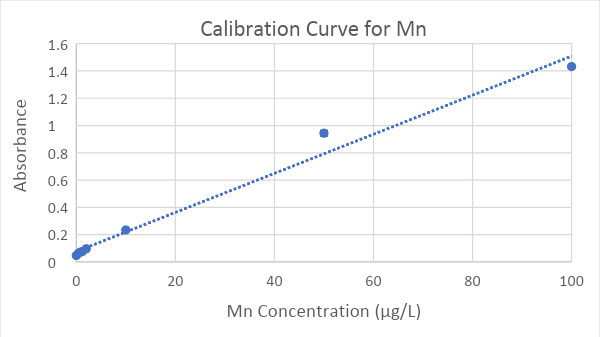
A linear regression equation (y = mx + b, where y = absorbance and x = concentration) was fit to the data; this equation was used to calculate the concentration of each metal (x) in our water samples using the absorbance (y) values measured by the atomic absorption spectrophotometer. The linear regression equations had R2 values of 0.984 and 0.9962 for Mn and Cu, respectively. The Cu concentrations strongly fit the linear regression equation across the entire range (Figure 3). The Mn concentrations from 0-25 μg/L strongly fit the linear regression equation, but the 50 μg/L and 100 μg/L concentrations were slightly above and below the trendline, respectively (Figure 4).
Results
The first result of this project was the development of the required methods, especially for the Shimadzu AA7000 spectrophotometer. This spectrophotometer is new at HCC, and our project is the first to employ it here. The AAS can produce analyses either in flame continuous mode or using the graphite furnace and our group had to determine which method to use. The flame analysis method allows measurement of metal concentrations in the mg/L range, while the graphite furnace method measures metal concentrations in the µg/L range. Cu and Mn analysis required the use of the graphite furnace because all the Cu and most of the Mn concentrations were too low to be detected using flame analysis (data not shown).
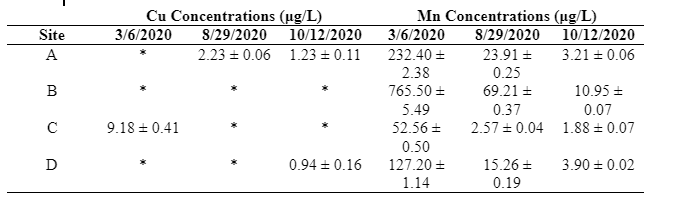
Table 1 shows that Cu levels in all samples were far below the EPA limit for drinking water of 1300 µg/L [2]. The highest concentration of Cu was measured at site C during the spring. Mn concentrations exceeded the EPA limit for drinking water of 50 µg/L [3] at all four sites in the spring and at site B in the summer. Site B had the highest Mn concentrations levels on all three dates, with site A having the second highest levels in the spring and summer. Site D had a slightly higher level in the autumn than sites A and C, but was still lower than site B. The highest Mn concentration measured in this study, 766 µg/L at site B on March 6, 2020, is over 15 times higher than the EPA limit for drinking water. The Mn concentration levels were consistently lowest at site C.
In addition, water quality data were recorded while sampling on October 12 (Table 2). The temperature of the water was warmer than the air temperature because the water cools more slowly than the air. Additional data are needed to see if water warms more slowly than air in the spring.
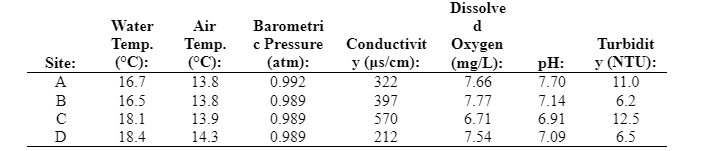
When the samples were collected in the summer and autumn, there were some indications of the water’s health. At site D in the summer, there were several crayfish living at the collection site. At site B in the autumn, there were a number of fish swimming in the area.
Discussion and Conclusions
The data indicate that Cu levels are within EPA drinking water quality limits for the entire year, and that Mn levels, with one exception, were mostly within EPA drinking water quality limits except during the spring. These results are good for Columbia in general and HCC specifically in that they indicate that there is not a problem with extraordinarily high levels of these metals in surface waters in the area in and around the HCC campus for much of the year. However, the Mn results during the spring indicate a problem which should be addressed.
The Cu levels showed no discernible pattern except for site A in the summer and autumn. The levels of Cu at site A during the summer and autumn were detectable, but were much lower than at site C in the spring. The highest level was at site C (the pond) in spring but the summer and autumn Cu levels at site C were below the detection limit (0.8 µg/L). At site D in the autumn, there was detectable Cu, but at only 0.9 µg/L, it was just above the detection limit. The level of Cu at site B was always below the detection limit.
The results for Mn have a clearer pattern. Unlike Cu, all Mn samples exceeded the detection limit of 0.5 µg/L. The concentration of Mn was greatest in spring 2020, and site B always had the highest levels for all three collections dates. Spring Mn concentrations were much higher than those detected later in the year, possibly because of road salting during the winter months. An alternative explanation would be that Mn levels were lower later in the year as a result of reduced road traffic on campus and on Little Patuxent Parkway due to the COVID-19 pandemic. Wen [1] showed that Mn is leached from soils by saline solutions; this suggests that salt used to treat roads during the winter dissolves in soil water and mobilizes soil Mn which enters surface waters. Manganese levels at site B may be higher than those at the other sampling sites because site B receives surface water from the Little Patuxent Parkway (off campus) in addition to on-campus sources. If further research substantiates the link between road salting and elevated Mn levels in the spring, our recommendation is that road salt use on campus be reduced. Site C always had the lowest Mn concentrations, no matter what the season. We hypothesize that this may have been a natural result of sampling a relatively large body of water that allowed Mn from the stream to dissipate, or there might be organisms in the pond that utilize Mn in their metabolism.
Experimental techniques underwent improvement during the course of this research. Frequent filter changes were required for the August 2020 sample from site C because of the amount of organic matter contained within this sample. We developed effective methods for running Cu and Mn samples with the AAS in graphite furnace mode, such as cleaning the water filter often and running 2% trace-metal grade nitric acid between samples. We also experimented with running Zn using the AAS, but discovered that it is not possible to obtain meaningful results for Zn without compensating for the interaction between Zn and Cl in these water samples.
These results are encouraging in that we have been able to establish and verify the methods we are using to collect, process, and analyze surface water samples for trace metals from the HCC campus, but more data are needed to verify the patterns observed in our limited data set. Ideally, we need to collect samples throughout the year to establish an annual pattern. Repeated sampling in future years will establish whether there is an annual pattern that is repeated or if metal levels in streams on the HCC campus vary from year to year as well as throughout the year.
Since procedures have been developed, in future studies it should be possible to analyze additional metals including Fe, Ni, and Zn, (correcting for chloride interference), and further ahead, research on metals such as lead (Pb) and mercury (Hg) to determine if the concentrations of these other trace metals are also of concern.
Acknowledgements
This group would like to thank the Science, Engineering, and Technology Division at HCC for providing us the opportunity to do this research, including Alex Barr and everyone else involved in facilitating the Undergraduate Research Program. Additionally, we would like to thank our mentors, Dr. Hannah Pie and Dr. Rebecca Carmody, the URSC-101 instructor Dr. Kathryn Jones, and the URSC-203 instructor Dr. Brendan Diamond.
Contacts: vincent.carmody@howardcc.edu, tuan.mai@howardcc.edu, hpie@howardcc.edu, rcarmody@howardcc.edu
References
[1] Y. Wen, “Impact of road de-icing salts on manganese transport to groundwater in roadside soils,” M.S. thesis, Dept. Land & Water Res. Eng., Royal Inst. Of Tech., Stockholm, Sweden, 2012. [Online]. Available: https://www.diva-portal.org/smash/get/diva2:580615/FULLTEXT01.pdf.
[2] U.S. Environmental Protection Agency. “National Drinking Water Regulations.” epa.gov. https://www.epa.gov/ground-water-and-drinking-water/national-primary-drinking-water-regulations#Inorganic. (Accessed on November 20, 2020).
[3] U.S. Environmental Protection Agency. “Drinking Water Health Advisory for Manganese.” epa.gov. https://www.epa.gov/sites/production/files/2014-09/documents/support_cc1_magnese_dwreport_0.pdf (Accessed on November 18, 2020).
[4] U.S. Geological Survey. “Contamination of Groundwater.” usgs.gov. https://www.usgs.gov/special-topic/water-science-school/science/contamination-groundwater?qt-science_center_objects=0# (Accessed on May 10, 2020).
[5] S. W. Ator, J. M. Denver, and C. A. Dieter, “Hydrogeology and shallow groundwater quality in the tidal Anacostia River watershed, Washington, DC.” U.S. Geological Survey. Reston. VA. USA. Scientific Investigations Report 2019-5128, 2020.
[6] M. D. Kozar, M. A. McAdoo, and K. B. Haase, “Groundwater quality and geochemistry of West Virginia’s southern coal fields.” U.S. Geological Survey. Reston. VA. USA. Scientific Investigations Report 2019-5059, Version 1.1, March 2020.
[7] D. A. Wentz, M. E. Brigham, L. C. Chasar, M. A. Lutz, and D. P. Krabbenhoft, “Mercury in the nation’s streams – levels, trends and implications.” U.S. Geological Survey. Reston. VA. USA. Circular 1395, 2014.
[8] J. Moore, D. L. Bird, S. K. Dobbis, and G. Woodward, “Nonpoint source contributions drive elevated major ion and dissolved inorganic carbon concentrations in urban watersheds,” Environ. Sci. technol. Lett 2017, 4, pp. 198-204, 2017, doi: 10.1021/acs.estlett.7b00096.
[9] J. Moore, R. M. Fanelli, and A. J. Sekellick, “High-frequency data reveal deicing salts drive elevated specific conductance and chloride along with pervasive and frequent exceedances of the U.S. Environmental Protection Agency aquatic life criteria for chloride in urban streams,” Environ. Sci. technol. Lett 2020, 54, pp. 778-789, 2017, doi: 10.1021/acs.est.9b04316.
[10] C. Beckjord, W. Straube, J. Kling, “Long term monitoring of a Howard Community College Campus Stream.” JRIP, Vol 2, pp. 28-38, 2019.
