
Ghosts of Parking Lots Past: The Effects of Legacy Pollution on Stream Health
Laura Wortman, Howard Community College
Sky Erickson, Howard Community College 2019, University of Maryland College Park
Mentored by: William Straube, Ph.D.
Abstract
High conductivity is often reported in urban streams with the ion source commonly attributed to the application of road salt in the winter. Salinization of freshwater streams poses a threat to the overall health of the stream system. After reviewing a recent two-year study monitoring the health of a Howard Community College campus stream, new research was conducted with a focus on identifying the possible ion sources responsible for elevated conductivity. Stream samples were tested for conductivity and chloride concentration, with results revealing a positive correlation between the two. The stream’s baseline remains relatively constant, suggesting that newly applied road salt is not the primary source of the stream’s high conductivity. The distribution of ions within the soil at each stream site suggest the presence of existing salt in addition to the newly applied road salt. Past site surveys indicate the presence of several gravel parking lots impacted by antiquated salting methods within the stream’s watershed. This legacy pollution is most likely the primary contributor of Scholarship Drive stream’s high conductivity.
Introduction
Samples collected from the Scholarship Drive stream display significantly high conductivity readings compared to other campus water bodies as well as Howard County and Maryland streams [1], [2], [3]. Both conductivity and chloride readings of soil and streams are increasing due to road salt, an increase in impervious land cover, and other anthropogenic influence within watersheds. Salinization of urban streams due to road salts and other contributing factors has been documented extensively [4], [5]. Saline water can damage infrastructure, increase erosion, and reduce water quality [6]. When salt infiltrates the soil, it can enter groundwater and make its way into rivers and streams [6]. As freshwater streams increase in conductivity and salt content, the aquatic life is compromised. Salt in streams will result in increased conductivity as ions from the salt become suspended in the water. The ideal conductivity for a freshwater stream ranges from 150 – 500 μS/cm [7]; this stream ranges from 545 – 7654 μS/cm.
Variation in stream conductivity is expected as each stream differs in geological makeup, stream flow, impervious ground cover, and exposure to pollutants. When compared to data collected from other Maryland streams, the conductivity and chloride readings from this stream not only show elevated readings, but surpass the ranges detected in others [3]. A closer examination into this stream’s conductivity and chloride content was collected and contributing factors were analyzed to identify possible sources of pollution. This analysis includes a close comparison of Scholarship Drive’s stream and Hickory Ridge’s stream revealing impacts of similar factors with historical evidence suggesting the source of the elevated levels may be due to legacy pollution from gravel parking lots. Legacy pollution is defined as the effect of contaminants introduced in the past that are no longer actively being deposited but continue to impact the natural environment.
The Scholarship Drive Stream is a tributary of the Little Patuxent River, which in turn flows into the Chesapeake Bay. Pollutants dumped in its watershed eventually make their way into the Bay. While the health of this tiny stream is important, it is critical to remember the impact that it, and streams like it, will have on larger ecosystems.
Methods
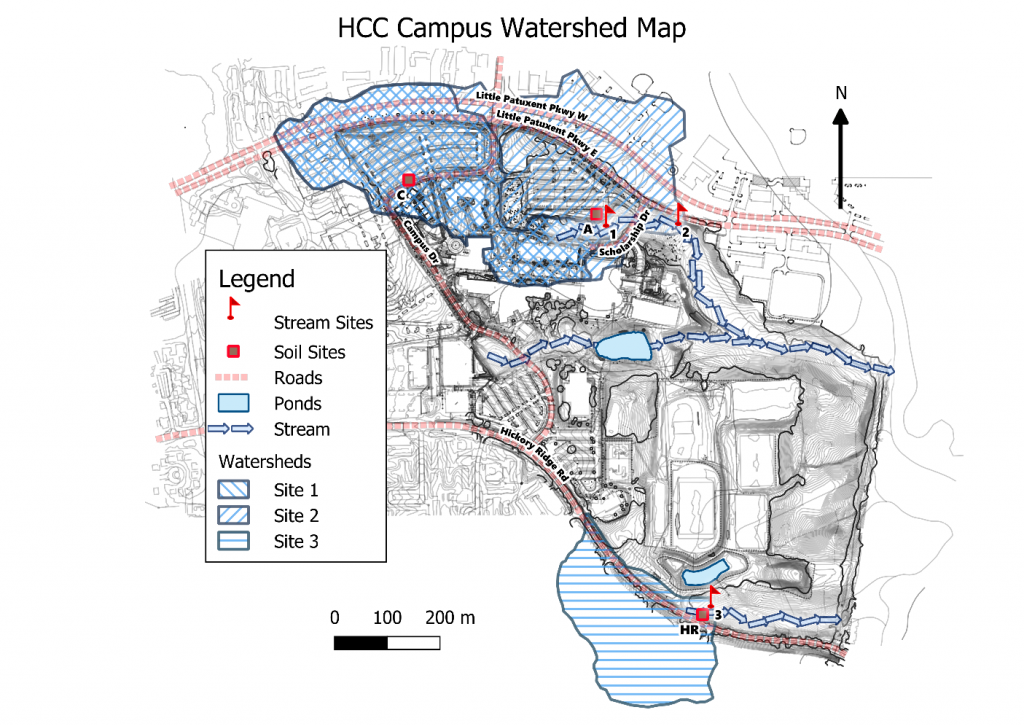
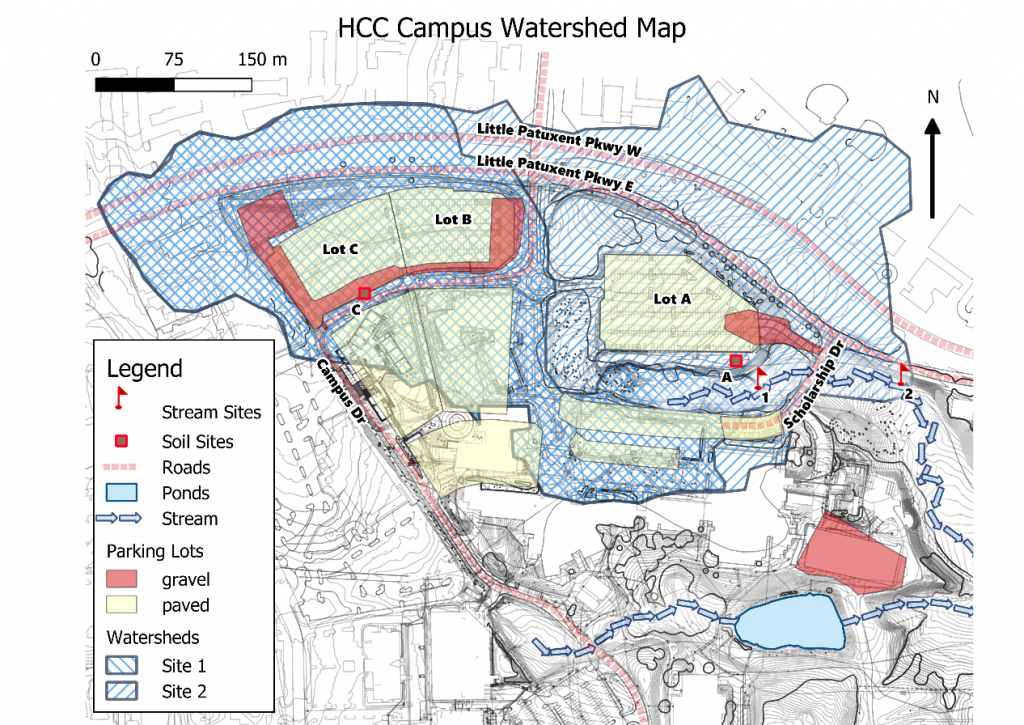
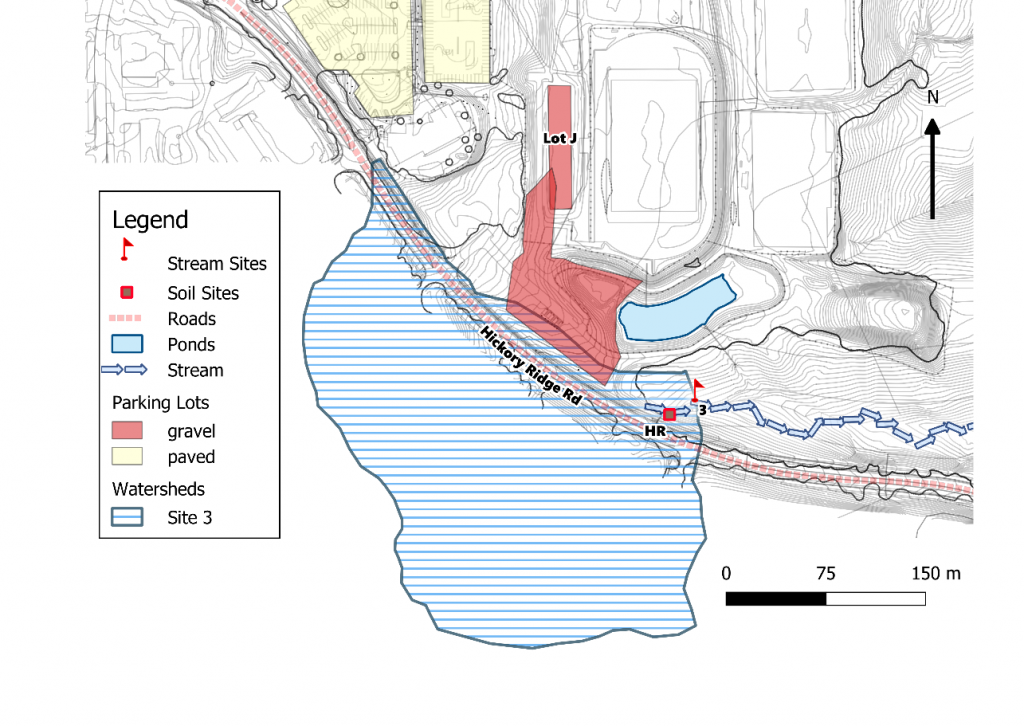
The two sites along the Scholarship Drive stream from the previous study [8] in which the elevated levels of conductivity were discovered were selected for continued monitoring [Fig. 1]. Another site near Hickory Ridge Road, Stream Site 3, was selected because of the stream’s similarity to Scholarship Drive’s. Both streams are located on HCC’s campus, are made up of the same soil composition, have forest buffers, and share proximity to impervious land cover, a road and sidewalk [9].
Stream water samples were collected approximately twice a week and following winter storm events in which road salt was applied. The Scholarship Drive sites were monitored for this study beginning October 18, 2019 and are referred to as Stream Site 1 and Stream Site 2. Stream Site 3 was added on December 20, 2020 to conduct a stream and soil conductivity comparison. Stream water was collected in 60 mL plastic containers with a plastic screw top. The samples were brought into the lab and allowed to reach room temperature to remove ambient and water temperature as variables in conductivity readings [10]. The room temperature samples were then tested for conductivity utilizing the LabQuest 2 with Vernier conductivity probe at the 20,000 μS/cm range. A random assortment of 22 samples were tested with the Vernier chloride probe, following the manufacturer’s protocol, to determine whether chloride and conductivity levels were correlated.
Soil sites A, C, and HR were chosen in each stream site’s watershed [Fig. 1]. The bounds of each watershed were determined using the USGS StreamStats tool [11] and HCC site plans [12]. Topsoil was scraped from the top 3 cm with a trowel and placed in a glass beaker. Approximately 100 g of soil from each site was added to 400 mL of DI water and mixed thoroughly in a glass beaker. The soil solution was left to sit for at least two days in order to allow soil particles to settle. The water was then tested with the Vernier conductivity probe.
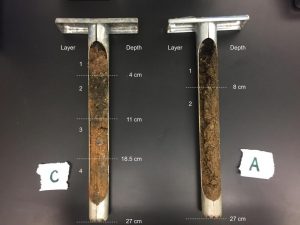
In order to investigate the possibility that salt concentrates in certain subsurface soil strata, core samples were collected with a steel core probe between parking lot A and C and Stream Sites 1 and 2. Parking lots A and C receive road salt applications prior to winter storm events and are within Scholarship Drive stream’s watershed. The soil layers of each core were identified and separated into tins to be measured. Approximately 30 g of each layer were added to 120 mL of DI water (a ratio proportional to the topsoil test) in glass beakers. Each solution was then tested utilizing the method used for the topsoil sites.
Throughout the study, HCC faculty and staff were consulted or interviewed to provide relevant information. Personal accounts along with both aerial [13] and ground photographs [14] provided evidence of historical gravel lots which were either paved over or tilled into the earth to allow for new construction. These gravel lots received excessive amounts of road salt during winter storm events.
Results
The conductivity of Stream Sites 1 and 2 remain high throughout the testing period [Fig. 2], with medians of 1943 μS/cm and 1733.5 μS/cm respectively, which are much higher than other area streams. For example, Stream Site 3 is significantly lower, 944 μS/cm, though still high compared to healthy streams. Dips in conductivity correspond with rainy days, which dilute the concentration.
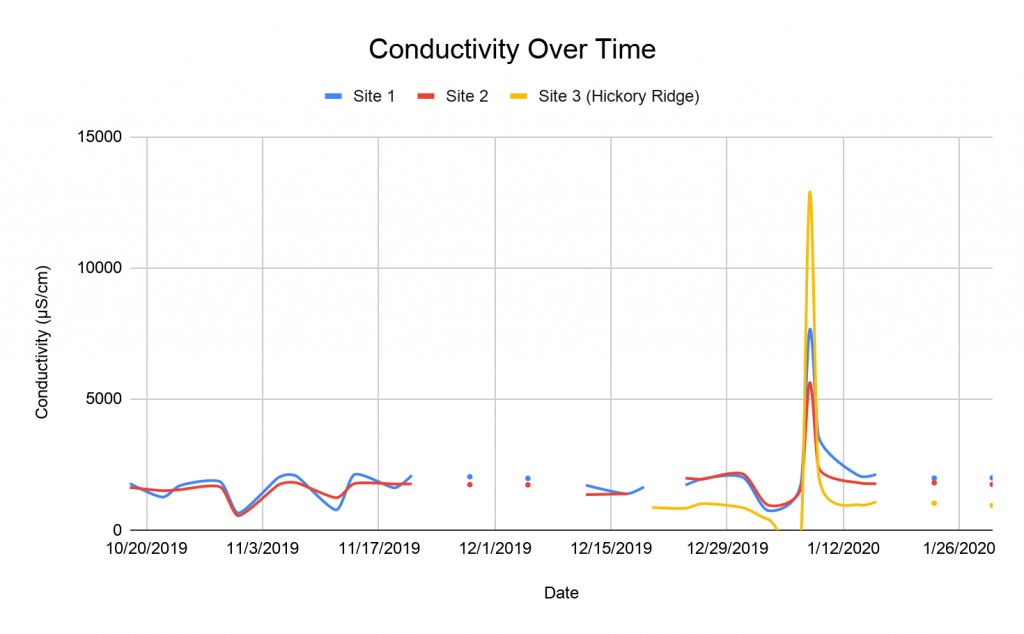
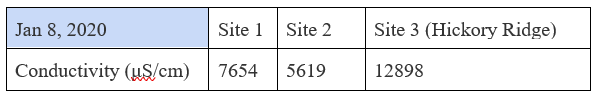
Three sample dates are noted as having had snow in the previous 48 hours: 11/14/2019, 12/12/2019, and 1/8/2020. The Hickory Ridge site was added after the first two snow dates, and so only includes the last. The first two snow dates did not appear to have a great impact on the conductivity of sites 1 and 2. It is possible that less salt was put down in anticipation of the first two snow dates than the last. According to local stations of the National Operational Hydrologic Remote Sensing Center [15], [16] the first two snow dates produced less than a millimeter of snow each. There was about 7.5 mm of precipitation 1/8/2020, the third snow date. Almost half of it was snow. A spike on January 8th corresponds with a rainy event following a winter road salt treatment [Fig. 3]. Preparation for this winter weather event is the most likely cause for the spike in conductivity. While all three sites showed a substantial increase in conductivity on January 8th, Stream Site 3 jumped significantly higher than Stream Sites 1 and 2. This suggests that roads in the Hickory Ridge site watershed are more heavily salted than the watersheds for Stream Sites 1 and 2.
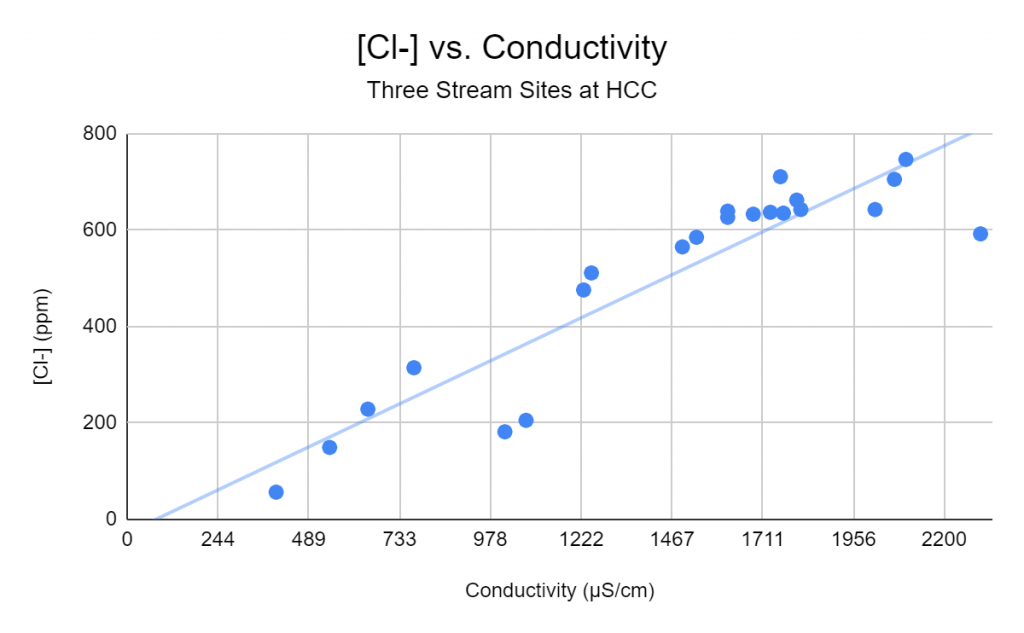
Several ion sources were discussed as possible causes of high conductivity. A reaction between calcium carbonate and acid rain would result in the presence of calcium and sulfate ions. Rock salt used for de-icing can also result in the presence of sodium and chloride ions, and is often found to be a major contributor to high conductivity in streams. Presence of chloride was investigated first due to availability of the proper equipment. Conductivity and chloride concentration of 22 samples were compared [Fig. 4], showing a strong correlation between the two, indicating that the cause of the high conductivity is NaCl from road salt. The mean chloride concentration threshold for chronic toxicity to freshwater life in 250 mg/L [4]; this stream has a mean of 506 mg
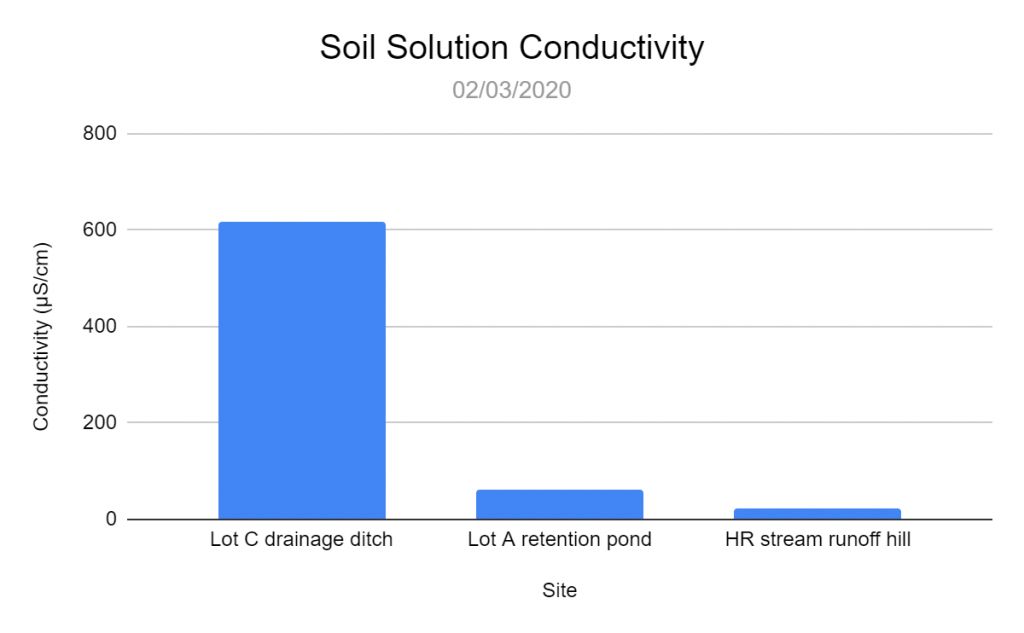
A comparison of the topsoil from pertinent locations in each watershed showed that a site at Lot C in Site 1 and 2’s watershed was much more conductive than others [Fig. 5]. If urban soil becomes salinized because of road salt [4], why does the stream that peaks higher during salting events have less conductive soil? While road salt may be a contributor, another source might explain the extreme levels.
Additionally, a Lot C core sample taken from the same day showed that conductivity remained high in lower layers of the soil. The surface layer of the soil core collected near Lot A showed much lower conductivity, and a deeper layer showed even lower conductivity [Fig. 6].
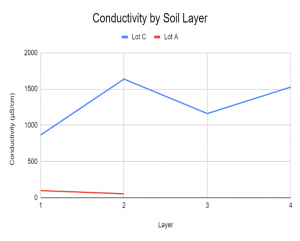
There are currently no obvious ion sources on the HCC campus that would not also be present in other local watersheds. Two campus streams were compared. Both streams were composed of similar geological makeup, but were at different slopes [9]. Both contained large areas of impervious ground cover in their watersheds including an adjacent road and sidewalk [9]. Forest buffers of similar size are located along each stream [9]. Although we are not able to qualify the stream flow due to lack of tools, they appear to be similar. When asked, several long-time HCC employees recalled changes in the parking situation. Lot C was once a gravel lot; another gravel lot was replaced by the campus quad [Fig. 8a, 8b, 9]. This anecdotal evidence was confirmed in aerial photographs retrieved from the Howard County Interactive Map [13]. Bob Marietta, the college’s Environmental Health and Safety Supervisor, described a de-icing method in which gravel lots were oversalted because gravel cannot be plowed. Leftover salt from this method would explain the abnormally high conductivity level of the soil in Lot C, even in deeper soil layers. The watershed of Stream Site 3 is not impacted by former gravel sites in the same manner Stream Sites 1 and 2 are.
Consideration of Possible Sources of Error
Some instrument error may exist due to calibration issues with the LabQuest.
The sample size of snow dates is limited due to a particularly warm winter. More data from the Hickory Ridge site during the warmer months would give a more accurate picture.
Some samples were lost due to spillage.
Suggestions for Continued Monitoring and Research
More extensive soil testing throughout each watershed would give a more comprehensive story. Samples from the quad may prove valuable because it served as the historical parking lot mentioned in the study. Additionally, a measurement of the stream’s flow would indicate whether the data is proportional to a stream of its size. Continued monitoring could lead to further understanding of HCC’s environmental effect on the stream’s health and determine whether its protective measures are adequate or improving the natural environment. Though no historical soil composition data exists for much of the campus, Howard EcoWorks has records of the soil compositions used in the rain gardens on campus prior to application. This historic record could be used to observe the effect of regular salting on campus rain gardens and how the soil conductivity changes over time.
Conclusion
Conductivity is abnormally high in one particular campus stream year-round. The source of the high conductivity was linked to NaCl, salt. High conductivity in urban streams has been commonly reported; however, conductivity levels on salt days compared to our control stream suggested that our watershed is subjected to less salting while year-round levels remain consistently higher. Anecdotal and archival evidence suggests that legacy pollution is the source of the majority of the salt. Soil data supports this, though more thorough sampling is needed.
When preparing the campus for human use, it is important to remember the impact human activities will have on the environment. HCC is currently utilizing traditional rock salt in conjunction with a brine treatment to minimize its adverse environmental effect. While current campus salting protocols take precautions to prevent polluting the environment, the careless methods used over a decade ago continue to affect nearby streams. This is the crux of the problem of legacy pollution; actions taken now can continue to impact the environment for years to come.
Contacts: wortman.laura.j@gmail.com, sky.r.erickson@outlook.com, wstraube@howardcc.edu
References
[1] Howard County Stream Waders, “HoCo Stream Wader Info ‘19,” [Online]. Available: https://www.howardwsa.org/hoco-stream-wader-info/
[2] Stream Health, Maryland Department of Natural Resources, n.d. [Online]. Available: https://geodata.md.gov/streamhealth/
[3] Results from high-frequency chloride and specific conductance analysis, Towson University, R. M. Fanelli, A. J. Sekellick, and J. Moore, Nov. 4, 2019. [Online]. Available: https://tigerweb.towson.edu/moore/chloride_map_12062019.html
[4] Kaushal, G. Likens, M. Pace, R. Utz, S. Haq, J. Gorman, and M. Grese, “Freshwater salinization syndrome on a continental scale,” Proceedings of the National Academy of Sciences of the United States of America, 23 January 2018. [Online]. Available: https://www.pnas.org/content/115/4/E574.full?. [Accessed February 2, 2020].
[5] Stranko, R. Bourquin, J. Zimmerman, M. Kashiwagi, M. McGinty, and R. Klauda, “Do Road Salts Cause Environmental Impacts?” Maryland Department of Natural Resources, April 2013 [Online]. https://dnr.maryland.gov/streams/Publications/RoadSalt2013.pdf. [Accessed February 2, 2020].
[6] Podmore, “Urban salinity – causes and impacts,” Primefacts 938, October 2009. [Online]. Available: https://www.dpi.nsw.gov.au/__data/assets/pdf_file/0004/309316/Urban-salinity-causes-and-impacts.pdf. [Accessed February 2, 2020].
[7] Friends of Sligo Creek, “Definition of Water Quality Parameters,” [Online]. Available: http://fosc.org/WQData/WQParameters.htm.
[8] Beckjord, and W. Straube, “Long Term Monitoring of a Howard Community College Stream,” Journal of Research in Progress, vol. 2, pp. 28-38. 2019.
[9] Natural Resources Conservation Service, “Soil Survey of Howard County, Maryland,” [Online]. Available: https://www.nrcs.usda.gov/Internet/FSE_MANUSCRIPTS/maryland/MD027/0/MDHoward5_08.pdf
[10] “Volunteer Stream Monitoring: A Methods Manual,” United States Environmental Protection Agency Office of Water, EPA 841-B-97-003, November 1997. [Online]. Available: https://www.epa.gov/sites/production/files/2015-06/documents/stream.pdf
[11] USGS, “Stream Stats”, v4.3.11. [Online]. Available: https://streamstats.usgs.gov/ss/
[12] Patton Harris Rust & Associates, “Overall SWM Drainage Area Map,” June, 2005, unpublished.
[13] Howard County, Maryland, “Howard County Interactive Map,” Howard County, MD, 2015. [Online]. Available: https://data.howardcountymd.gov/InteractiveMap.html
[14] Hinton, collection of photographs, “HCC Past,” unpublished.
[15] “Interactive Snow Information, Station MD-HW-11” National Operational Hydrologic Remote Sensing Center, https://www.nohrsc.noaa.gov/interactive/html/graph.html?station-MD-HW-11. [Accessed February 2, 2020].
[16] “Interactive Snow Information, Station MD-HW-31” National Operational Hydrologic Remote Sensing Center, https://www.nohrsc.noaa.gov/interactive/html/graph.html?station-MD-HW-31. [Accessed February 2, 2020].
