
The Relationship Between Soil Texture, Land Use, and Passive Versus Out-competing Species in Urban Forest Patches
Charise Pelan-Maclean, Howard Community College
Mentored by: Cheryl J. Campo, PhD.
Abstract
Urban forest patches are in every large scale city, yet little is known about them. Being in such close contact with human interactions could have huge effects on species growth type and soil that is found in the forest patch. These small interactions built over a long time could change the landscape of the entire forest patch. Focusing on urban forest patches in Baltimore will help establish a relationship between land use history and the type of plant species that have grown in response to human interaction stressors. In addition, to how soil texture has changed throughout the forest patches. Twelve urban forest patches in Baltimore, Maryland were investigated as part of this study. Each forest patch was overlaid with a grid and at 40-meter intervals a point location was determined. At each point location, soil texture, ground cover species, number of trees, and tree species was recorded. Focusing on Herring run 2 and Southwest Area Park which were identified as opposing urban forest patches. Herring Run 2 had the least amount of land use history and Southwest Area Park had the most. This study focused on the presence of passive versus out-competing ground cover and tree species in relation to soil texture and land use history.
It was hypothesized that both 1) soil texture, specifically higher clay content, and 2) increased human use would increase the presence of out-competing species. The data only half supported this. There was no apparent correlation between soil textures and the relative abundance of passive or out-competing ground cover or tree species. The most predominant soil texture type throughout the two parks was sandy loam and loamy sand. In the instance of Herring Run 2, the site with a less disturbed land use history, both ground cover and tree species were more of the passive variety than out-competing whereas the site with a more disturbed land use history exhibited the opposite, both observations of which are in agreement with the above hypothesis. Also, the data suggests that land use may have a lower impact on ground cover than tree species with respect to relative abundances of passive versus out-competing species.
Introduction
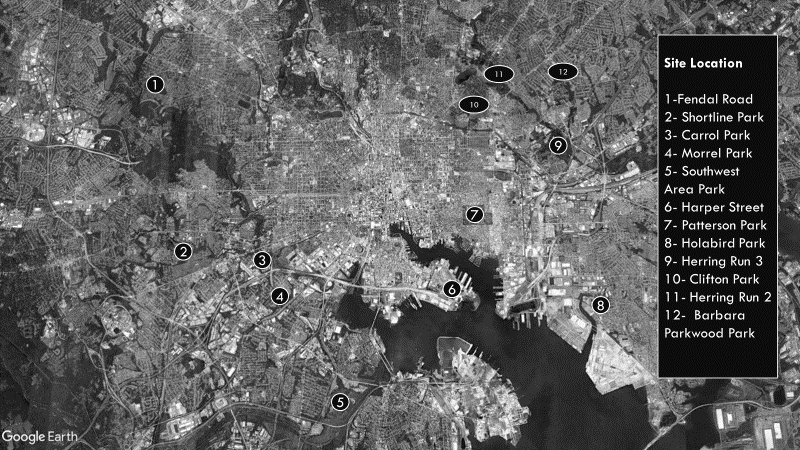
Twelve site locations throughout Baltimore were selected as urban forest patches. These urban forests had a thick tree canopy that encompassed an area of at least 200 square meters. The site locations of the urban forest patches are as follows: Fendall Road, Shortline Park, Carroll Park, Morrell Park, Southwest Area Park, Harper Street, Patterson Park, Holabird Park, Herring Run 3, Clifton Park, Herring 2, and Barbara Parkwood Park as shown in Figure 1. This study will focus on Herring Run 2 and Southwest Area Park.
According to a study done for the city of Baltimore, in 1973 the two parks being focused on—Herring Run 2 and Southwest Area Park—were considered forest and barren land, respectfully [1]. The city of Baltimore purchased portions of the land for Herring Run 2 in 1826, making it one of Baltimore’s oldest parks. In the 1980s, the city of Baltimore bought the land for Southwest Area Park, developing it into a park. Before Baltimore had expanded to its current size, the land went through many transformations. Before pre-European settlers arrived (5000 B.C.-1600 A.D.), the land around Baltimore was predominantly oak-hickory, closed canopy forests. After European settlers arrived (1600-1800), 20-40% of the land was cleared for small farms, tobacco, iron furnaces, and construction. From 1800-1900, large plots of land were being cleared for agriculture to support a growing population surrounding the city as well as metropolitan expansion [2].
When restoring previously human-impacted areas that were used for agriculture or industry, it is important to note that these processes degrade the soil. If urban forests are planned for areas with degraded soil the forests will not be able to sustain themselves without human intervention leading to mass species death [3]. This may lead to park developers using certain plant species to restore soil. These species can have a detrimental impact on the area, due to having an open space in which they can freely grow with little competition from other species [4].
This study will use the terms out-competing and passive to differentiate between two different plant species categories. Out-competing plants are comparable to invasive species and will include plants that can outperform in resource gain and growth in an area. Generally, once present, out-competing species will become over abundant and suppress other plant growth in the same area [5]. Passive species are those that grow well in ideal conditions; however, their growth can be hindered when conditions are no longer ideal. Many native species will be considered passive however some do out-compete their native members given the chance [6].
Soil texture has an influence on plant growth by determining how much a plant can grow. Soil texture can influence plant growth via water-holding capacity, soil workability, and permeability. Soil texture is separated into three different particle sizes: sand, silt, and clay. Sand is the largest particle while clay is the smallest [7].
Materials and Methods
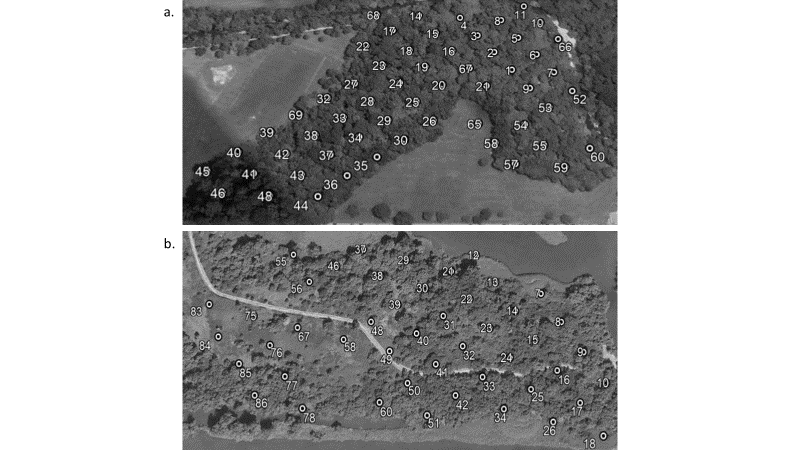
The twelve locations were first surveyed by aerial imaging that ascertained how thick the canopy was. The process of measuring the canopy was termed as a blob which was measured by lasers on a helicopter. Once the parks with blobs were selected, using Google Earth, an overlaying grid was placed on top of them and at each cross section of the grid a point location was placed, thereby creating approximate 40m x 40m squares. The coordinates were recorded for each point location.
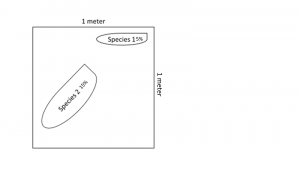
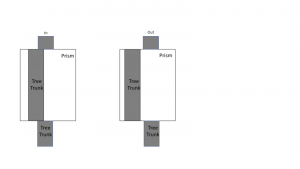
Upon reaching the coordinates of a given point and placing a flag down to mark it, one person stood at the point with a 1m x 1m PVC pipe square and gently tossed it behind them randomly. The ground cover species that were inside of the pipe square was recorded as a representative area of the 40m x 40m square. An example of what a 1m x 1m area might look like is shown in Figure 3a. In addition, above the flag one person would hold a rectangular wedge prism approximately 4.5 meters above the ground to determine what trees would be recorded. If a tree trunk appearing in a rectangular wedge prism overlapped with the trunk outside of the prism, the tree was considered “in”. If the trunks in and out of the prism did not overlap at all then the tree was considered out. See Figure 3b.
In addition to plant species being identified at each point, a soil texture was also collected. Soil texture (e.g., sand, loamy sand, sandy loam, sandy clay, clay loam, sandy clay loam, silty clay loam, silty clay, silt loam, loam and clay) was found by feel at each point. The soil was manipulated with a small amount of water to determine the approximate amount of sand, silt and clay that the soil contained. The soil was tested for how long of a ribbon it could make as well as how gritty or smooth it was before breaking.
Results and Discussion
Herring Run 2
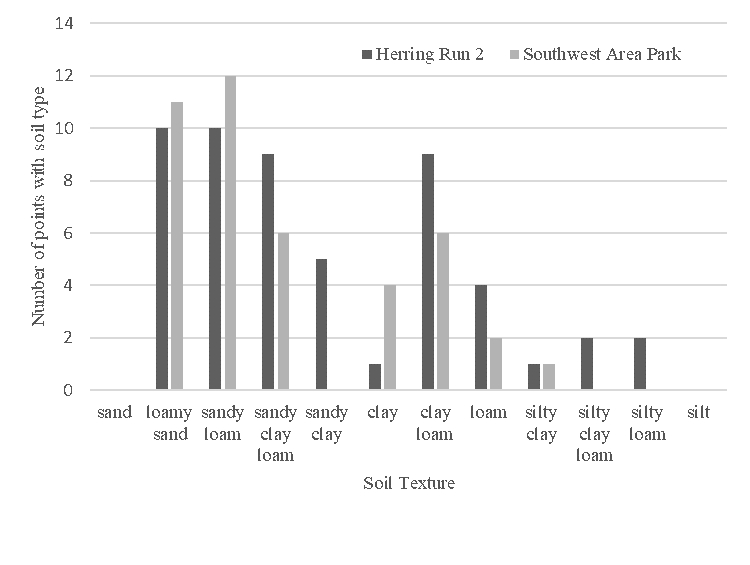
In 2010, Herring Run 2 was still defined as a forest [1], signifying that the city had done little to change the landscape of the area since 1973. The soil in Herring Run 2 is diverse with many different soil textures (see figure 4). Ten out of the twelve soil texture were identified in the park. No dominate soil texture in relation to out-competitive species was recognized in either tree or ground cover species. However, sandy loam and loamy sand was the dominating soil texture found throughout the park at 10 point locations each.
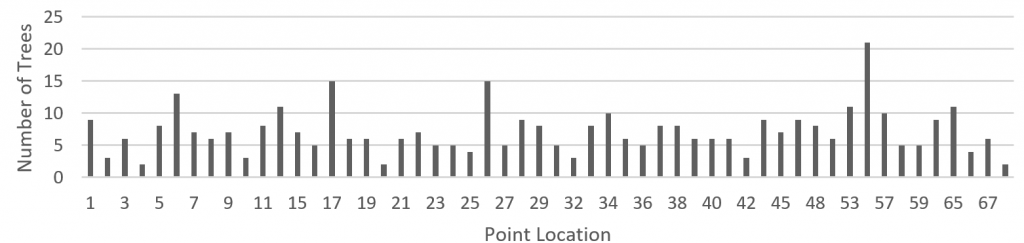
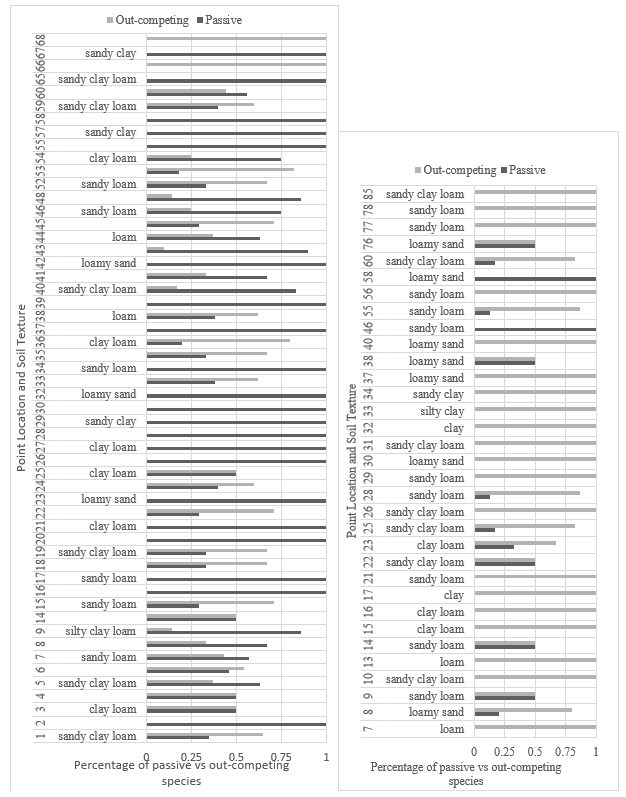
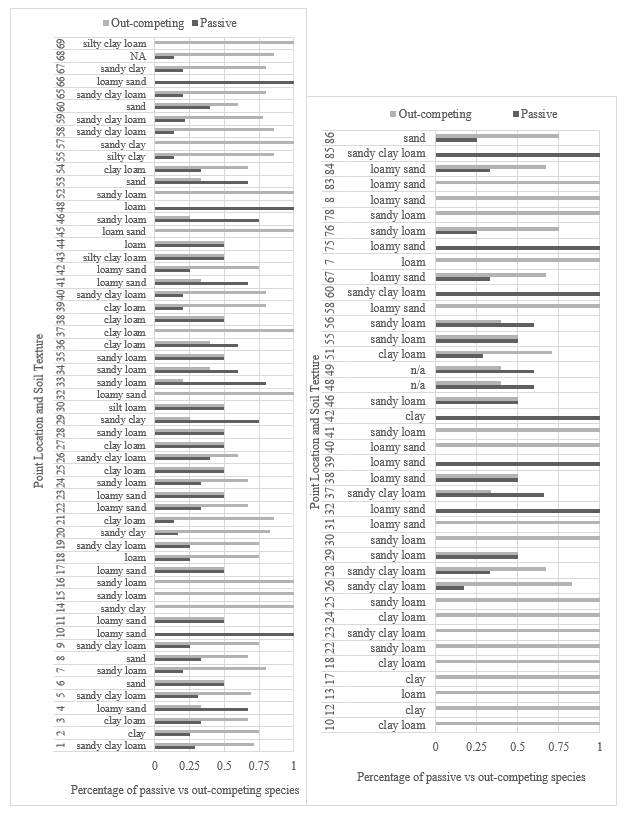
For tree species, 21 out of 54 point locations were 100% passive species, while only 2 out of the 54 point locations were 100% out-competing species (see Figure 7). In addition, 12 of the point locations had above 50% passive species and 14 points had above 50% out- competing species. The number of trees species found at each point location can show how abundant the passive or out-competing species are in relation to their presence in the overall park (see Figure 5). The average tree count for the whole park is 7.13. The average tree count for 100% passive tree species is 7.81 and 7.25 for points above 50% whereas the average tree count for the 100% out-competing tree species is 3 and 7.67 for points above 50%. This suggests that when the species are mixed together, out-competing tree species are more abundant than by themselves. For ground cover, out of 57 point locations, only three point locations had 100% passive species while nine point locations had 100% out-competing species (see Figure 8). Ten point locations had an equal ratio of passive to out-competing species. Eight points had above 50% passive species and 25 had above 50% out-competing species.
Overall, tree species were 76% passive and 24% out-competing whereas ground cover species were 53% passive and 47% out-competing.
Southwest Area Park
In 2010, Southwest area park was defined as a wet land [1], signifying that the city had spent effort to change the landscape from its barren appearance designation in 1973. The soil in Southwest Area Park is less diverse and only features seven of the twelve soil textures (see figure 4). No dominate soil texture in relation to out-competitive species was recognized in either tree or ground cover species. However, sandy loam was the dominant soil texture found throughout the park at twelve point locations.
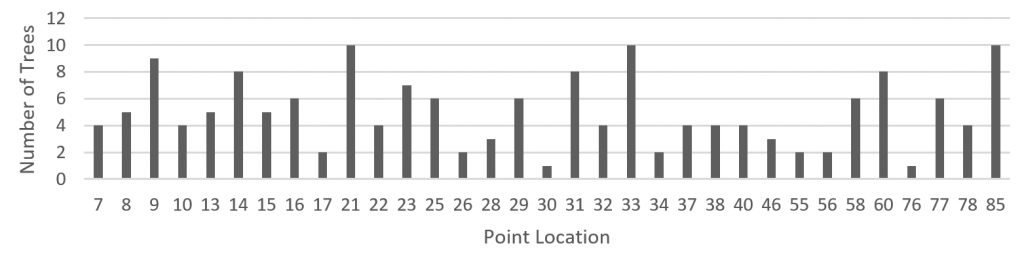
For tree species, 2 out of 33 point locations were 100% passive species, while 20 out of the 33 points had 100% out-competing species (see Figure 7). In addition, 5 point locations had an equal ratio of passive to out-competing species. Zero of the points had above 50% passive species and 6 points had above 50% out-competing species. As with the Herring Run 2 analysis, the numbers of tree species found at each point location can show how abundant the passive or out-competing species are in relation to the overall park (see Figure 6). The average tree count for the whole park is 5.00. The average tree count for 100% passive tree species is 4.5 whereas the average tree count for the 100% out-competing tree species is 5.16. The average tree count for the above 50% out-competing species is 5.17; therefore, sites that have a higher percentage of out-competing species also had a higher tree count throughout the park suggesting that predominantly out-competing tree species are more likely to be found in the park. For ground cover, 6 out of 39 point locations were 100% passive species, while 18 out of the 39 points had 100% out-competing ground cover species (see Figure 8). In addition, 4 point locations had an equal ratio of passive to out-competing species. Four of the points had above 50% passive species and 7 points had above 50% out-competing species.
Overall tree species were 15% passive and 85% out-competing whereas ground cover species were 23% passive and 77% out-competing.
Conclusions and Future Directions
Herring Run 2 and Southwest Park are two urban forest patches that have a different land history use. Soil texture seemed to have no correlation with passive or out-competing species as the soil at locations was highly variable. For tree species it was observed that higher disturbed land use will lead to a larger percentage of the population that is out-competing. For ground cover species the same is also true, however, the data showed that land use may have less of an impact on the percentage of the population that is out-competing as evidenced by the smaller differential between passive and out-competing species.
In the future, determining if there is a relationship between certain tree species and ground cover species could lead to further insights in the population trends of certain forest patches. In addition, how the surrounding fauna population interacts with the flora population could give insights as to why certain forest patches have an over or under abundance of certain flora species.
Notes
Only the topsoil was considered when calculating soil texture. Minor data input errors could have occurred leading to some species being counted twice or not at all.
Six student researches were present throughout the study that provided subjective data (soil texture). This could have resulted in different textures to be recorded throughout the study. Analyzing soil samples is one of the next steps to be taken in this study.
Acknowledgements
Project was in conjunction with UMBC and HCC undergraduate environmental science research partnership.
Contacts: charise.pelanmaclean@howardcc.edu, ccampo@howardcc.edu
References
[1] Marland GIS, “MDP Land Use / Land Cover Interactive Map,” [Online]. Available: http://mdpgis.mdp.state.md.us/landuse/imap/index.html?dynTheme=dynExample2&webmap=92f9de5c81354ec48164352923527d76&extentBBox=-8867121.453183487,4570166.319597734,-8389848.648571078,4834638.437464317&extentSR=102100. [Accessed November 2019].
[2] T. Foresman, “The Baltimore-Washington Regional Collaboratory Land-Use History Research Program,” December 2018. [Online]. Available: https://archive.usgs.gov/archive/sites/landcover.usgs.gov/luhna/chap5.html. [Accessed November 2019].
[3] B. Simmons, H. Richard, N. S. Nancy and A. D. S. N., “Long-term outcomes of forest restoration in an urban park,” Restoration Ecology, vol. 24, no. 1, pp. 109-118, 2015.
[4] D. Lamb, P. Erskine and J. Parrotta, “Restoration of Degraded Tropical Forest Landscapes,” American Association for the Advancement of Science, vol. 310, pp. 1628-1632, 2005.
[5] National Ocean service , “What is an invasive species?,” National Ocean service , 7 July 2019. [Online]. Available: https://oceanservice.noaa.gov/facts/invasive.html. [Accessed November 2019].
[6] R. Colautti and M. Hugh, “A neutral terminology to define ‘invasive’,” Diversity and Distributions, vol. 10, pp. 135-141, 2004.
[7] I. Krupenikov, B. Boincean and D. Dent, The black earth: ecological principles for sustainable agriculture on chernozem soils, Springer, 2011.
[8] D. Tilman, C. L. Lehman and K. T. Thomson, “Plant diversity and ecosystem productivity: Theoretical considerations,” PNAS, vol. 94, no. 5, pp. 1857-1861, 1997.
