
Work and Labor in the United States
Learning Objectives
- Discuss the changes industrialization brought in the relationship between workers and management.
- Outline recent trends in jobs and wages.
- Describe the current U.S. workforce and the trend of polarization
- Explain how women and immigrants have changed the modern U.S. workforce
- Understand the problem of unemployment in the United States today
The American Dream has always been based on opportunity. There is a great deal of mythologizing about the energetic upstart who can climb to success based on hard work alone. Common wisdom states that if you study hard, develop good work habits, and graduate high school or, even better, college, then you’ll have the opportunity to land a good job. That has long been seen as the key to a successful life. And although the reality has always been more complex than suggested by the myth, the worldwide recession that began in 2008 took its toll on the American Dream. During the recession, more than 8 million U.S. workers lost their jobs, and unemployment rates surpassed 10 percent on a national level. Today, while the recovery is still incomplete, many sectors of the economy are hiring, and unemployment rates have receded.
Workers and Management After Industrialization
One of the most important developments accompanying industrialization was the rise of labor unions and their conflict with management over wages and working conditions (Dubofsky & Dulles, 2010). The pay that workers received was quite low, and the conditions in which they worked were often miserable. The typical employee worked at least 10 hours a day for 6 or 7 days a week, with almost no overtime pay and no paid vacations or holidays. To improve wages and working conditions, many labor unions were founded after the Civil War, only to meet determined opposition from companies, the government, and the courts. Companies told each other which workers were suspected of being union members, and these workers were then prevented from getting jobs. Strikers were often arrested for violating laws prohibiting strikes. When juries began finding them not guilty, employers turned to asking judges for injunctions that prohibited strikes. Workers who then went on strike were held in contempt of court by the judge as juries were kept out of the process.
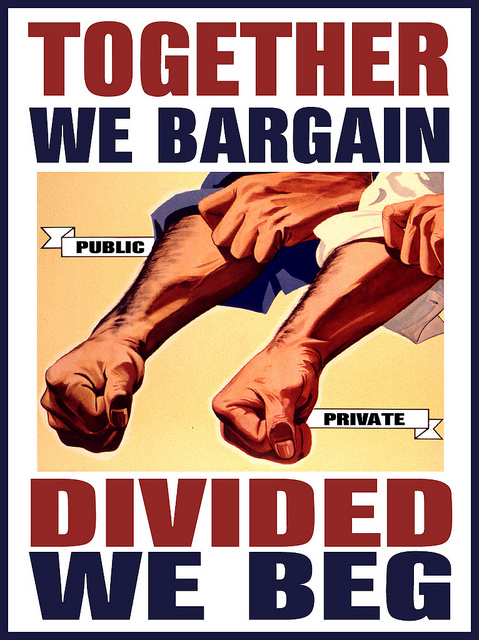
From the 1870s through the 1930s, labor unions fought companies over issues such as low wages and substandard working conditions.
DonkeyHotey – Together We Bargain – CC BY 2.0.
Many strikes became violent, as companies brought in armed guards, state troopers, and strikebreakers to put down the strikes. Workers themselves rioted to protest their low wages and abject working conditions. Summarizing this period, two labor historians note that the United States “has had the bloodiest and most violent labor history of any industrial nation in the world” (Taft & Ross, 1990, p. 174). During an 1897 coal-mining strike in Pennsylvania, for example, 18 miners were killed and 40 wounded after being shot in the back by a sheriff’s deputies. Several years later, company guards and state troops in Ludlow, Colorado, opened fire on mining families as they fled from a tent city that the guards and troops had set on fire. Their bullets killed more than two dozen people, including 13 children (McGovern & Guttridge, 1972).
Labor strife reached a peak during the Great Depression, as masses of people blamed business leaders for their economic plight. Huge sit-ins and other labor protests occurred in Detroit at auto plants. In response the Congress passed several laws that gave workers a minimum wage, the right to join unions, a maximum-hour workweek, and other rights that Americans now take for granted.
Today labor unions have lost some of their influence, especially as postindustrialization has supplanted the industrial economy and as the United States has lost much of its manufacturing base. Four decades ago, about one-fourth of all private-sector nonagricultural workers belonged to labor unions. By 1985 this figure had dropped to 14.6%, and today it stands at less than 8% (Hirsch & Macpherson, 2009). In response, labor unions have ramped up their efforts to increase their membership, only to find that U.S. labor laws are filled with loopholes that allow companies to prevent their workers from forming a union. For example, after a company’s workers vote to join a union, companies can appeal the vote, and it can take several years for courts to order the company to recognize the union. In the meantime, the low wages, the working conditions, and other factors that motivated workers to want to join a union are allowed to continue.
Recent Trends in Jobs and Wages
The mix of jobs available in the United States began changing many years before the recession struck, and, as mentioned above, the American Dream has not always been easy to achieve. Geography, race, gender, and other factors have always played a role in the reality of success. More recently, the increased outsourcing—or contracting a job or set of jobs to an outside source—of manufacturing jobs to developing nations has greatly diminished the number of high-paying, often unionized, blue-collar positions available. A similar problem has arisen in the white-collar sector, with many low-level clerical and support positions also being outsourced, as evidenced by the international technical-support call centers in Mumbai, India, and Newfoundland, Canada. The number of supervisory and managerial positions has been reduced as companies streamline their command structures and industries continue to consolidate through mergers. Even highly educated skilled workers such as computer programmers have seen their jobs vanish overseas.
The automation of the workplace, which replaces workers with technology, is another cause of the changes in the job market. Computers can be programmed to do many routine tasks faster and less expensively than people who used to do such tasks. Jobs like bookkeeping, clerical work, and repetitive tasks on production assembly lines all lend themselves to automation. Envision your local supermarket’s self-scan checkout aisles. The automated cashiers affixed to the units take the place of paid employees. Now one cashier can oversee transactions at six or more self-scan aisles, which was a job that used to require one cashier per aisle.
Polarization in the Workforce
Despite the ongoing economic recovery, the job market is actually growing in some areas, but in a very polarized fashion. Polarization means that a gap has developed in the job market, with most employment opportunities at the lowest and highest levels and few jobs for those with midlevel skills and education. At one end, there has been strong demand for low-skilled, low-paying jobs in industries like food service and retail. On the other end, some research shows that in certain fields there has been a steadily increasing demand for highly skilled and educated professionals, technologists, and managers. These high-skilled positions also tend to be highly paid (Autor 2010).
The fact that some positions are highly paid while others are not is an example of the class system, an economic hierarchy in which movement (both upward and downward) between various rungs of the socioeconomic ladder is possible. Theoretically, at least, the class system as it is organized in the United States is an example of a meritocracy, an economic system that rewards merit––typically in the form of skill and hard work––with upward mobility. A theorist working in the functionalist perspective might point out that this system is designed to reward hard work, which encourages people to strive for excellence in pursuit of reward. A theorist working in the conflict perspective might counter with the thought that hard work does not guarantee success even in a meritocracy, because social capital––the accumulation of a network of social relationships and knowledge that will provide a platform from which to achieve financial success––in the form of connections or higher education are often required to access the high-paying jobs. Increasingly, we are realizing intelligence and hard work aren’t enough. If you lack knowledge of how to leverage the right names, connections, and players, you are unlikely to experience upward mobility.
With so many jobs being outsourced or eliminated by automation, what kind of jobs are there a demand for in the United States? While fishing and forestry jobs are in decline, in several markets jobs are increasing. These include community and social service, personal care and service, finance, computer and information services, and healthcare. The chart below, from the U.S. Bureau of Labor Statistics, illustrates areas of projected growth.
The professional and related jobs, which include any number of positions, typically require significant education and training and tend to be lucrative career choices. Service jobs, according to the Bureau of Labor Statistics, can include everything from jobs with the fire department to jobs scooping ice cream (Bureau of Labor Statistics 2010). There is a wide variety of training needed, and therefore an equally large wage potential discrepancy. One of the largest areas of growth by industry, rather than by occupational group (as seen above), is in the health field. This growth is across occupations, from associate-level nurse’s aides to management-level assisted-living staff. As baby boomers age, they are living longer than any generation before, and the growth of this population segment requires an increase in capacity throughout our country’s elder care system, from home healthcare nursing to geriatric nutrition.
Notably, jobs in farming are in decline. This is an area where those with less education traditionally could be assured of finding steady, if low-wage, work. With these jobs disappearing, more and more workers will find themselves untrained for the types of employment that are available.
Another projected trend in employment relates to the level of education and training required to gain and keep a job. As the chart below shows us, growth rates are higher for those with more education. Those with a professional degree or a master’s degree may expect job growth of 20 and 22 percent respectively, and jobs that require a bachelor’s degree are projected to grow 17 percent. At the other end of the spectrum, jobs that require a high school diploma or equivalent are projected to grow at only 12 percent, while jobs that require less than a high school diploma will grow 14 percent. Quite simply, without a degree, it will be more difficult to find a job. It is worth noting that these projections are based on overall growth across all occupation categories, so obviously there will be variations within different occupational areas. However, once again, those who are the least educated will be the ones least able to fulfill the American Dream.
In the past, rising education levels in the United States had been able to keep pace with the rise in the number of education-dependent jobs. However, since the late 1970s, men have been enrolling in college at a lower rate than women, and graduating at a rate of almost 10 percent less. The lack of male candidates reaching the education levels needed for skilled positions has opened opportunities for women, minorities, and immigrants (Wang 2011).
Women in the Workforce
Women have been entering the workforce in ever-increasing numbers for several decades. They have also been finishing college and going on to earn higher degrees at higher rate than men do. This has resulted in many women being better positioned to obtain high-paying, high-skill jobs (Autor 2010).
Figure 13.2 Labor Force Participation Rate, Percentage of Married Women with Children Younger Than 6 Years of Age, 1960–2007

Source: Data from U.S. Census Bureau. (2010). Statistical abstract of the United States: 2010. Washington, DC: U.S. Government Printing Office. Retrieved from http://www.census.gov/compendia/statab.
The Equal Pay Act, passed by the U.S. Congress in 1963, was designed to reduce the wage gap between men and women. The act in essence required employers to pay equal wages to men and women who were performing substantially similar jobs. However, more than fifty years later, women continue to make less money than their male counterparts. According to a report released by the White House (National Equal Pay Taskforce 2013), “On average, full-time working women make just 77 cents for every dollar a man makes. This significant gap is more than a statistic—iit has real-life consequences. When women, who make up nearly half the workforce, bring home less money each day, it means they have less for the everyday needs of their families, and over a lifetime of work, far less savings for retirement.” While the Pew Research Center contends that women make 84 cents for every dollar men make, countless studies that have controlled for work experience, education, and other factors unanimously demonstrate that disparity between wages paid to men and to women still exists (Pew Research Center 2014).
As shocking as it is, the gap actually widens when we add race and ethnicity to the picture. For example, African American women make on average 64 cents for every dollar a White male makes. Latina women make 56 cents, or 44 percent less, for every dollar a White male makes. African American and Latino men also make notably less than White men. Asian Americans tend to be the only minority that earns as much as or more than White men.
Immigration and the Workforce
Simply put, people will move from where there are few or no jobs to places where there are jobs, unless something prevents them from doing so. The process of moving to a country is called immigration. Due to its reputation as the land of opportunity, the United States has long been the destination of all skill levels of workers. While the rate decreased somewhat during the economic slowdown of 2008, immigrants, both documented and undocumented, continue to be a major part of the U.S. workforce.
In 2005, before the recession arrived, immigrants made up a historic high of 14.7 percent of the workforce (Lowell et al. 2006). During the 1970s through 2000s, the United States experienced both an increase in college-educated immigrants and in immigrants who lacked a high school diploma. With this range across the spectrum, immigrants are well positioned for both the higher-paid jobs and the low-wage low-skill jobs that are predicted to grow in the next decade (Lowell et al. 2006). In the early 2000s, it certainly seemed that the United States was continuing to live up to its reputation of opportunity. But what about during the recession of 2008, when so many jobs were lost and unemployment hovered close to 10 percent? How did immigrant workers fare then?
The answer is that as of June 2009, when the National Bureau of Economic Research (NEBR) declared the recession officially over, “foreign-born workers gained 656,000 jobs while native-born workers lost 1.2 million jobs” (Kochhar 2010). As these numbers suggest, the unemployment rate that year decreased for immigrant workers and increased for native workers. The reasons for this trend are not entirely clear. Some Pew research suggests immigrants tend to have greater flexibility to move from job to job and that the immigrant population may have been early victims of the recession, and thus were quicker to rebound (Kochhar 2010). Regardless of the reasons, the 2009 job gains are far from enough to keep them inured from the country’s economic woes. Immigrant earnings are in decline, even as the number of jobs increases, and some theorize that increase in employment may come from a willingness to accept significantly lower wages and benefits.
While the political debate is often fueled by conversations about low-wage-earning immigrants, there are actually as many highly skilled––and high-earning––immigrant workers as well. Many immigrants are sponsored by their employers who claim they possess talents, education, and training that are in short supply in the U.S. These sponsored immigrants account for 15 percent of all legal immigrants (Batalova and Terrazas 2010). Interestingly, the U.S. population generally supports these high-level workers, believing they will help lead to economic growth and not be a drain on government services (Hainmueller and Hiscox 2010). On the other hand, undocumented immigrants tend to be trapped in extremely low-paying jobs in agriculture, service, and construction with few ways to improve their situation without risking exposure and deportation.
Unemployment
Unemployment is a fact of life. There will always be people laid off or fired, who voluntarily quit their jobs, or who just graduated school and are still looking for work. But most unemployed people are involuntarily unemployed, and for them the financial and psychological consequences can be devastating, as we saw at the beginning of this chapter.
We cannot even rely on unemployment statistics to provide a clear picture of total unemployment in the United States. First, unemployment statistics do not take into account underemployment, a state in which a person accepts a lower paying, lower status job than their education and experience qualifies them to perform. Second, unemployment statistics only count those:
- who are actively looking for work
- who have not earned income from a job in the past four weeks
- who are ready, willing, and able to work
The unemployment statistics provided by the U.S. government are rarely accurate, because many of the unemployed become discouraged and stop looking for work. Not only that, but these statistics undercount the youngest and oldest workers, the chronically unemployed (e.g., homeless), and seasonal and migrant workers.
A certain amount of unemployment is a direct result of the relative inflexibility of the labor market, considered structural unemployment, which describes when there is a societal level of disjuncture between people seeking jobs and the available jobs. This mismatch can be geographic (they are hiring in California, but most unemployed live in Alabama), technological (skilled workers are replaced by machines, as in the auto industry), or can result from any sudden change in the types of jobs people are seeking versus the types of companies that are hiring.
Because of the high standard of living in the United States, many people are working at full-time jobs but are still poor by the standards of relative poverty. They are the working poor. The United States has a higher percentage of working poor than many other developed countries (Brady, Fullerton and Cross 2010). In terms of employment, the Bureau of Labor Statistics defines the working poor as those who have spent at least 27 weeks working or looking for work, and yet remain below the poverty line. Many of the facts about the working poor are as expected: Those who work only part time are more likely to be classified as working poor than those with full-time employment; higher levels of education lead to less likelihood of being among the working poor; and those with children under 18 are four times more likely than those without children to fall into this category. In 2009, the working poor included 10.4 million Americans, up almost 17 percent from 2008 (U.S. Bureau of Labor Statistics 2011).
Most developed countries such as the United States protect their citizens from absolute poverty by providing different levels of social services such as unemployment insurance, welfare, food assistance, and so on. They may also provide job training and retraining so that people can reenter the job market. In the past, the elderly were particularly vulnerable to falling into poverty after they stopped working; however, pensions, retirement plans, and Social Security were designed to help prevent this. A major concern in the United States is the rising number of young people growing up in poverty. Growing up poor can cut off access to the education and services people need to move out of poverty and into stable employment. As we saw, more education was often a key to stability, and those raised in poverty are the ones least able to find well-paying work, perpetuating a cycle.
There is great debate about how much support local, state, and federal governments should give to help the unemployed and underemployed. The decisions made on these issues will have a profound effect on working in the United States.
We have just seen that unemployment rises when the economy falters and that race and ethnicity affect the probability of being unemployed. These two facts provide evidence supporting the sociological imagination. As C. Wright Mills (1959) emphasized in his original discussion of this concept, unemployment is best viewed more as a public issue than as a personal trouble. When so many people are unemployed during an economic recession and when there is such striking evidence of higher unemployment rates among the persons of color who have the least opportunity for the education and training needed to obtain and keep a job, it is evident that high unemployment rates reflect a public issue rather than just a collection of public troubles.
Several kinds of problems make it difficult for people of color to be hired into jobs and thus contribute to the racial/ethnic disparity in unemployment. The “Sociology Making a Difference” box discusses these problems.
Key Takeaways
- Conflict between labor and management was intense in the United States after the advent of industrialization. Strikes and labor-related violence were common after the Civil War.
- The move to a postindustrial economy has resulted in a loss of jobs in the United States, thanks in part to capital flight and outsourcing.
- The US Workforce is becoming increasingly polarized around race, gender, and educational qualifications.
- Unemployment has soared because of the Great Recession that began in late 2007. Joblessness has significant consequences for the financial and psychological well-being of the millions of people who are unemployed.
Self Check
Sociology Making a Difference
Race, Ethnicity, and Employment
Sociological research has documented that people of color face several kinds of problems in securing employment. While their relative lack of education is an obvious factor, other kinds of problems are also apparent.
One problem is racial discrimination on the part of employers, regardless of how conscious employers are of their discriminatory behavior. Chapter 10 “Race and Ethnicity” recounted a study by sociologist Devah Pager (2007), who had young white and African American men apply independently in person for various jobs in Milwaukee. These men wore the same type of clothing and reported similar levels of education and other qualifications. Some said they had a criminal record, while others said they had not committed any crimes. In striking evidence of racial discrimination in hiring, African American applicants without a criminal record were hired at the same low rate as white applicants with a criminal record. Pager and sociologists Bruce Western and Bart Bonikowski also investigated racial discrimination in another field experiment in New York City (Pager, Bonikowski, & Western, 2009). They had white, African American, and Latino “testers,” all of them “well-spoken, clean-cut young men” (p. 781), apply in person to low-level service jobs (e.g., retail sales and delivery drivers) requiring no more than a high school education; all the testers had similar (hypothetical) qualifications. Almost one-third (31%) of white testers received a call back or job offer, compared to only 25.2% of Latino testers and 15.2% of African American testers. The researchers concluded that their findings “add to a large research program demonstrating the continuing contribution of discrimination to racial inequality in the post-civil rights era” (p. 794).
Other kinds of evidence also reveal racial discrimination in hiring. Two scholars sent job applications in response to help-wanted ads in Boston and Chicago (Bertrand & Mullainathan, 2003). They randomly assigned the applications to feature either a “white-sounding” name (e.g., Emily or Greg) or an “African American–sounding” name (e.g., Jamal and Lakisha). White names received 50% more callbacks than African American names for job interviews.
Racial differences in access to the informal networks that are often so important in finding a job also contribute to the racial/ethnic disparity in employment. In a study using data from a nationwide survey of a random sample of Americans, sociologist Steve McDonald and colleagues found that people of color and women are less likely than white males to receive informal word of vacant, high-level supervisory positions (McDonald, Nan, & Ao, 2009).
As these studies indicate, research by sociologists and other social scientists reveals that race and ethnicity continue to make a difference in employment prospects for Americans. This body of research reveals clear evidence of discrimination, conscious or unconscious, in hiring and also of racial/ethnic differences in access to the informal networks that are often so important for hiring. By uncovering this evidence, these studies underscore the need to address discrimination, access to informal networks, and other factors that contribute to racial and ethnic disparities in employment. For this reason, sociology is again making a difference.
References
Autor, David. 2010. “The Polarization of Job Opportunities in the U.S. Labor Market Implications for Employment and Earnings.” MIT Department of Economics and National Bureau of Economic Research, April. Retrieved February 15, 2012 (http://econ-www.mit.edu/files/5554).
Batalova, Jeanne, and Aaron Terrazas. 2010. “Frequently Requested Statistics on Immigrants and Immigration in the United States.” Migration Policy Institute. Retrieved February 6, 2012 (http://www.migrationinformation.org/USfocus/display.cfm?id=818).
Bertrand, M., & Mullainathan, S. (2003). Are Emily and Greg more employable than Lakisha and Jamal? A field experiment on labor market discrimination. National Bureau of Economic Research (Working Paper No. 9873). Retrieved from http://papers.nber.org/papers/w9873.pdf.
Dubofsky, M., & Dulles, F. R. (2010). Labor in America: A history (8th ed.). Wheeling, IL: Harlan Davidson.
Hainmueller, Jens, and Michael J. Hiscox. 2010. “Attitudes Toward Highly Skilled and Low-Skilled Immigration: Evidence from a Survey Experiment.” American Political Science Review 104:61–84.
Hirsch, B., & Macpherson, D. (2009). Union membership and coverage database from the CPS. Retrieved from http://unionstats.com.
Kochhar, Rokesh. 2010. “After the Great Recession: Foreign Born Gain Jobs; Native Born Lose Jobs.” Pew Hispanic Center, October 29. Retrieved January 29, 2012 (http://pewresearch.org/pubs/1784/great-recession-foreign-born-gain-jobs-native-born-lose-jobs).
Lowell, Lindsay B., Julia Gelatt, and Jeanne Batalova. 2006. “Immigrants and Labor Force Trends: the Future, Past, and Present.” Migration Policy Institute Insight No. 17. Retrieved February 6, 2012 (http://www.migrationpolicy.org/ITFIAF/TF17_Lowell.pdf).
McDonald, S., Nan, L., & Ao, D. (2009). Networks of opportunity: Gender, race, and job leads. Social Problems, 56(3), 385–402.
McGovern, G. S., & Guttridge, L. F. (1972). The great coalfield war. Boston, MA: Houghton Mifflin.
Mills, C. W. (1959). The sociological imagination. London, England: Oxford University Press.
Pager, D. (2007). Marked: Race, crime, and finding work in an era of mass incarceration. Chicago, IL: University of Chicago Press.
Pager, D., Bonikowski, B., & Western, B. (2009). Discrimination in a low-wage labor market: A field experiment. American Sociological Review, 74(5), 777–799.
Taft, P., & Ross, P. (1990). American labor violence: Its causes, character, and outcome. In N. A. Weiner, M. A. Zahn, & R. J. Sagi (Eds.), Violence: Patterns, causes, public policy (pp. 174–186). San Diego, CA: Harcourt Brace Jovanovich.
U.S. Census Bureau. (2009). Statistical abstract of the United States: 2009. Washington, DC: U.S. Government Printing Office. Retrieved from http://www.census.gov/compendia/statab.
U.S. Bureau of Labor Statistics. 2010. Occupational Outlook Handbook, 2006–2007 ed. Retrieved from February 15, 2012 (www.bls.gov/oco).
U.S. Bureau of Labor Statistics. 2010. “Overview of the 2008-2018 Projections.” Occupational Outlook Handbook, 2010–2011 ed. Retrieved February 15, 2012 (http://www.bls.gov/oco/oco2003.htm#industry).
U.S. Bureau of Labor Statistics. 2011. “A Profile of the Working Poor, 2009.” Retrieved January 25, 2012 (www.bls.gov/cps/cpswp2009.pdf).
U.S Bureau of Labor Statistics. 2012. “Employment Projections–2010–20.” U.S. Department of Labor. Retrieved December 15, 2014. (http://www.bls.gov/news.release/archives/ecopro_02012012.pdf).
U.S. Bureau of Labor Statistics. 2013. “Occupational Employment Projections to 2022.” Deoartment of Labor. Retrieved December 15, 2014. (http://www.bls.gov/opub/mlr/2013/article/pdf/occupational-employment-projections-to-2022.pdf).
U.S. Bureau of Labor Statistics. 2013. “Table 7: Employment by Summary Education and Training Assignment, 2012 and Projected 2022.” United States Department of Labor. Retrieved December 15, 2014. (http://www.bls.gov/news.release/ecopro.t07.htm).
U.S. Census Bureau. 2010. “Income, Poverty, and Health Insurance Coverage in the United States.” Retrieved February 15, 2012 (http://www.census.gov/prod/2011pubs/p60-239.pdf).
Wang, Wendy and Kim Parker. 2011. “Women See Value and Benefit of College; Men Lag Behind on Both Fronts.” Pew Social and Demographic Trends, August 17. Retrieved January 30, 2012 (http://www.pewsocialtrends.org/2011/08/17/women-see-value-and-benefits-of-college-men-lag-on-both-fronts-survey-finds/5/#iv-by-the-numbers-gender-race-and-education).
