
The Nature and Extent of Global Stratification
Learning Objectives
- Explain why the terms First World, Second World, and Third World have fallen out of use.
- Explain why it is important to measure global poverty.
- Describe which world regions have higher or lower inequality and why.
- Describe the main arguments of modernization theory, dependency theory, and world systems theory.
Just as the United States’ wealth is increasingly concentrated among its richest citizens while the middle class slowly disappears, global inequality is concentrating resources in certain nations and is significantly affecting the opportunities of individuals in poorer and less powerful countries. In fact, a recent Oxfam (2014) report that suggested the richest eighty-five people in the world are worth more than the poorest 3.5 billion combined. Put more simply, there is an extreme difference between the richest and poorest nations. A few nations, such as the United States, are very, very wealthy, while many more nations are very, very poor. Reflecting this latter fact, 40% of the world’s population, or about 2 billion people, lives on less than $2 per day (United Nations Development Programme, 2005).
While stratification in the United States refers to the unequal distribution of resources among individuals, global stratification refers to this unequal distribution among nations. There are two dimensions to this stratification: gaps between nations and gaps within nations. When it comes to global inequality, both economic inequality and social inequality may concentrate the burden of poverty among certain segments of the earth’s population (Myrdal 1970).
Classifying Global Stratification
To understand global stratification, it is helpful to classify nations into three or four categories based on their degree of wealth or poverty, their level of industrialization and economic development, and related factors. Over the decades, scholars and international organizations such as the United Nations and the World Bank have used various classification systems, or typologies.
One of the first typologies came into use after World War II and classified nations as falling into the First World, Second World, and Third World. The First World was generally the Western capitalist democracies of North America and of Europe and certain other nations (e.g., Australia, New Zealand, and Japan). The Second World was the communist nations belonging to the Soviet Union, while the Third World was all the remaining nations, almost all of them from Central and South America, Africa, and Asia. This classification was useful in distinguishing capitalist and communist countries and in calling attention to the many nations composing the Third World. However, it was primarily a political classification rather than a stratification classification. This problem, along with the demise of the Soviet Union by the end of 1991, caused this typology to fall out of favor.
A replacement typology placed nations into developed, developing, and undeveloped categories, respectively. Although this typology was initially popular, critics said that calling nations “developed” made them sound superior, while calling nations “undeveloped” made them sound inferior. Although this classification scheme is still used, it, too, has begun to fall out of favor.
Today a popular typology simply ranks nations into groups called wealthy (or high-income) nations, middle-income nations, and poor (or low-income) nations, based on measures such as gross domestic product (GDP) per capita (the total value of a nation’s goods and services divided by its population). This typology has the advantage of emphasizing the most important variable in global stratification: how much wealth a nation has. At the risk of being somewhat simplistic, the other important differences among the world’s nations all stem from their degree of wealth or poverty. Figure 9.3 “Global Stratification Map” depicts these three categories of nations (with the middle category divided into upper-middle and lower-middle). As should be clear, whether a nation is wealthy, middle-income, or poor is heavily related to the continent on which it is found.
Figure 9.3 Global Stratification Map

Source: Adapted from UNEP/GRID-Arendal Maps and Graphics Library. (2009). Country income groups (World Bank classification). Retrieved from http://maps.grida.no/go/graphic/country-income-groups-world-bank-classification.
Typologies based on GDP per capita or similar economic measures are very useful, but they also have a significant limitation. Nations can rank similarly on GDP per capita (or another economic measure) but still differ in other respects. One nation might have lower infant mortality, another might have higher life expectancy, and a third might have better sanitation. Recognizing this limitation, organizations such as the United Nations Development Programme (UNDP) use typologies based on a broader range of measures than GDP per capita. A very popular typology is the UNDP’s Human Development Index (HDI), which is a composite measure of a nation’s income, health, and education. This index is based on a formula that combines a nation’s GDP per capita as a measure of income; life expectancy at birth as a measure of health; and the adult literacy rate and enrollment in primary, secondary, and higher education as measures of education. Figure 9.4 “International Human Development, 2008” shows how nations rank according to the HDI. As will be evident, this map looks fairly similar to the map in Figure 9.3 “Global Stratification Map” that was based only on GDP per capita; the nations that rank high on human development are the wealthiest nations, and those that rank lowest on human development, such as Ethiopia and Rwanda, are the poorest nations.
Figure 9.4 International Human Development, 2008

Source: Adapted from United Nations Development Programme. (2010). International human development indicators. Retrieved from http://hdr.undp.org/en/data/map.
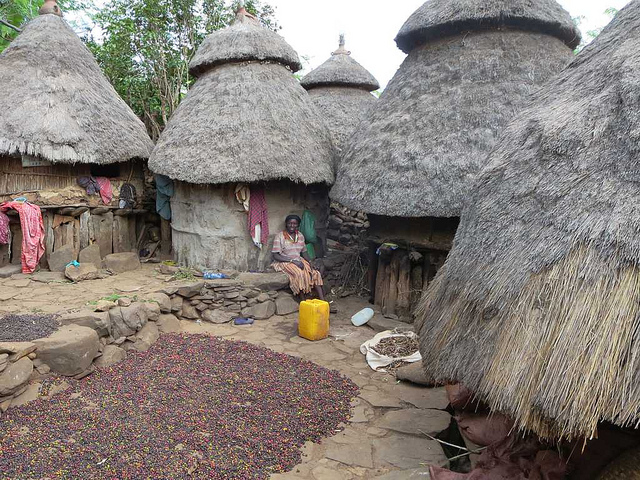
This scene illustrates poverty in Ethiopia. Nations that rank lowest on human development, such as Ethiopia, also are the poorest nations.
David Stanley – Coffee Beans Drying – CC BY 2.0.
This similarity prompts some observers to say that the HDI is not really that much of an improvement over typologies based only on GDP per capita or similar economic measures. Still, the HDI has been widely used since the 1990s and reminds us that nations differ dramatically not only in their economic well-being but also in their social well-being. However, because health, education, and other social indicators do depend so heavily on wealth, our discussion of global stratification for the remainder of this chapter will use the familiar classification of wealthy, middle-income, and poor nations.
Global Poverty
In addition to classifying nations according to their ranking on a stratification typology, scholars and international organizations also determine the level of poverty in each nation. This determination provides valuable information beyond a nation’s GDP per capita or similar measure of wealth. Wealth and poverty are, of course, highly correlated: generally speaking, the wealthier a nation, the lower its level of poverty. However, this correlation is not perfect, and considering nations only in terms of their wealth may obscure important differences in their levels of poverty. For example, two nations, which we will call Nation A and Nation B, may have similar GDP per capita. In Nation A, wealth from its GDP is fairly evenly distributed, and relatively few people are poor. In Nation B, almost all wealth is held by a small number of incredibly rich people, and many people are poor. A nation’s level of poverty thus tells us what proportion of the population is living in dire straits, regardless of the nation’s level of wealth.
The measurement of global poverty is important for additional reasons (Haughton & Khandker, 2009). First, political and economic officials will not recognize the problem of poverty and try to do something about it unless they have reliable poverty data to motivate them to do so and to guide their decisions. As two experts on international poverty note, “It is easy to ignore the poor if they are statistically invisible” (Haughton & Khandker, 2009, p. 3). Second, valid measures of poverty reveal which regions of the world are poorest and which people in a given nation are poorest in terms of household characteristics (e.g., households headed by a single woman), location (e.g., region of country or urban vs. rural), and other factors. This type of knowledge enables antipoverty programs and strategies to be focused on the locations and people in those locations who are most in need of help. Third, valid measures of poverty enable officials and policymakers to know how well efforts to help the poor are working, as a poverty measure after some intervention can be compared to the poverty measure before the intervention.
How, then, is global poverty measured? A very common and popular measure is one used by the World Bank, an international institution, funded by wealthy nations, that provides loans, grants, and other aid to help poor and middle-income nations develop their infrastructure and thus reduce their poverty. Each year the World Bank publishes its World Development Report, which, as its name implies, provides statistics and other information on the economic and social well-being of the globe’s almost 200 nations. The World Bank puts the official global poverty line (which is considered a measure of extreme poverty) at income under $1.25 per person per day, which amounts to about $456 yearly per person or $1,825 for a family of four. According to this measure, 1.4 billion people, making up more than one-fifth of the world’s population and more than one-fourth of the population of developing (poor and middle-income) nations, are poor. This level of poverty rises to 40% of South Asia and 51% of sub-Saharan Africa (Haughton & Khandker, 2009).
Poverty Indexes
The United Nations Development Programme (UNDP), which developed the Human Development Index, discussed earlier, to measure global stratification, also developed a similar measure, the Human Poverty Index (HPI), to measure global poverty, and it has reported this measure since the 1990s. This measure reflects UNDP’s belief that poverty means more than a lack of money and that measures of poverty must include nonmonetary components of social well-being. Accordingly, the HPI incorporates measures of the following indicators for developing nations: (a) the probability of not surviving to age 40, (b) the percentage of adults who are illiterate, (c) the percentage of people without access to clean water, and (d) the percentage of underweight children. In UNDP’s 2009 Human Development Report, the five poorest countries according to HPI were Afghanistan, Niger, Mali, Chad, and Burkina Faso, with more than half the population in each of these countries classified as poor (United Nations Development Programme, 2009).
Although the HPI has been very useful, it was recently replaced by a more comprehensive measure, the Multidimensional Poverty Index (MPI). The MPI incorporates a range of deprivation measures applied to each nation’s households that is fuller than that of the HPI. Households are considered poor according to their composite score on three categories of indicators of deprivation:
-
Health
- Child mortality (any child in the household has died)
- Nutrition (anyone in the family is malnourished)
-
Education
- Schooling (no household member has completed 5 years of schooling)
- Enrollment (any child in the family is not in school before grade 9)
-
Standard of living
- Electricity (the household does not have electricity)
- Drinking water (the household does not have access to clean drinking water)
- Sanitation (the household does not have adequate disposal of human waste)
- Flooring (the floor is made out of dirt, sand, or manure [dung])
- Cooking fuel (the household cooks with charcoal, dung, or wood)
- Assets (the household does not own more than one of the following: bicycle, motorbike, radio, telephone, or television)
A person is considered poor if he or she experiences deprivation in any of the following combinations of indicators:
- any two health and/or education indicators, or
- all six standard of living indicators, or
- one health/education indicator plus three standard of living indicators.
When the MPI is used to measure poverty in 104 developing nations, 1.7 billion people, amounting to one-third the population of these nations, live in poverty. Half of the poor people on the planet according to the MPI live in South Asia, and one-fourth live in Africa (Alkire & Santos, 2010). The five poorest nations according to the MPI are all African: Niger, Ethiopia, Mali, Burkina Faso, and Burundi. In these nations, at least 85% of the population is poor.
Although monetary and index measures of global poverty yield somewhat different results, the measures are still fairly highly correlated, and they all indicate that the poorest regions of the world are Africa and South Asia. These measures have played an essential role in our understanding of global poverty and in international efforts to address it and its consequences.
Global Inequality
As first discussed in Chapter 8 “Social Stratification”, another dimension of stratification is economic inequality, which refers to the gap between the richest and poorest segments of society. We saw then that the United States has more economic inequality than other Western democracies, as the income and wealth difference between the richest and poorest people in the United States is greater than that in these other nations.
As this discussion suggested, to understand stratification it is important to understand economic inequality. Global economic inequality (hereafter global inequality) has two dimensions. The first dimension involves the extremely large economic gap between the wealthy and poor nations of the world (Neckerman & Torche, 2007). We saw evidence of this gap in our earlier Monopoly discussion: the richest one-fifth of nations have almost 75% of the world’s income, while the poorest fifth of nations have only 1.5% of the world’s income. Dividing the larger figure by the smaller figure (75 ÷ 1.5) yields a very high income-gap ratio of 50: the income of the richest fifth of nations is 50 times greater than the income of the poorest fifth of nations. By comparison, in the United States the income of the richest fifth of the population is 11.5 times higher than the income of the poorest fifth (see Chapter 8 “Social Stratification”). Although economic inequality within the United States is greater than its Western counterparts, economic inequality between the richest and poorest nations is much greater yet.
The most popular measure of economic inequality, and one used by the World Bank, is the Gini coefficient. Its calculation need not concern us, but it ranges from 0 to 1, where 0 means that income is the same for everyone (no economic inequality at all, or perfect equality), and 1 means that one person has all the income (perfect inequality). Thus the nearer the Gini coefficient is to 1, the higher the degree of a nation’s economic inequality.
Figure 9.5 “Gini Coefficients, 2007–2008” shows Gini coefficients around the world; economic inequality is indeed higher in the agricultural regions of Latin America and the Caribbean, Africa, South Asia, and elsewhere than in the industrial region of Western Europe. In the developing world, the region of Latin America and the Caribbean has a more advanced agricultural economy than other regions, and it also has the highest degree of inequality, with a small elite owning a great amount of land (Hoffman & Centeno, 2003).
Figure 9.5 Gini Coefficients, 2007–2008

Explanations of global stratification parallel those of U.S. stratification (see Chapter 8 “Social Stratification”) in their focus on individual versus structural problems. One type of explanation takes an individual approach by in effect blaming the people in the poorest nations for their own poverty, while a second explanation takes a structural approach in blaming the plight of poor nations on their treatment by the richest ones. Again there is evidence to support both types of explanations, but many sociologists favor the structural explanation. Table 9.2 “Theory Snapshot” summarizes the two sets of explanations.
Table 9.2 Theory Snapshot
| Theory | Major assumptions |
|---|---|
| Modernization theory | Wealthy nations became wealthy because early on they were able to develop the necessary beliefs, values, and practices for trade, industrialization, and rapid economic growth to occur. Poor nations remained poor because they failed to develop these beliefs, values, and practices; instead, they continued to follow traditional beliefs and practices that stymied industrial development and modernization. |
| Dependency theory
World Systems Theory |
The poverty of poor nations stems from their colonization by European nations, which exploited the poor nations’ resources and either enslaved their populations or used them as cheap labor. The colonized nations were thus unable to develop a professional and business class that would have enabled them to enter the industrial age and to otherwise develop their economies.
The global stratification of nations is the result of complex economic hierarchy established historically that placed some nations in positions of power with numerous resources and other nations in a state of economic subordination. Those that were in a state of subordination faced significant obstacles to mobilization. |
Modernization Theory
The individual explanation is called modernization theory (McClelland, 1967; Rostow, 1990). According to this theory, rich nations became wealthy because early on they were able to develop the “correct” beliefs, values, and practices—in short, the correct culture—for trade, industrialization, and rapid economic growth to occur. These cultural traits include a willingness to work hard, to abandon tradition in favor of new ways of thinking and doing things, and to adopt a future orientation rather than one focused on maintaining present conditions.
Modernization theory has direct relevance for the experience of Western Europe. According to the theory, Western European nations began to emerge several centuries ago as economic powers because their populations adopted the kinds of values and practices just listed. Max Weber (1904/1958), one of the founders of sociology, wrote that Western Europe was able to do this because the Protestant Reformation diminished the traditional distrust of the Catholic Church for material success and social and economic change. The new Protestant ethic that Western Europeans adopted stressed the importance of hard work and material success in one’s lifetime rather than the Church’s traditional emphasis on rewards in an afterlife.
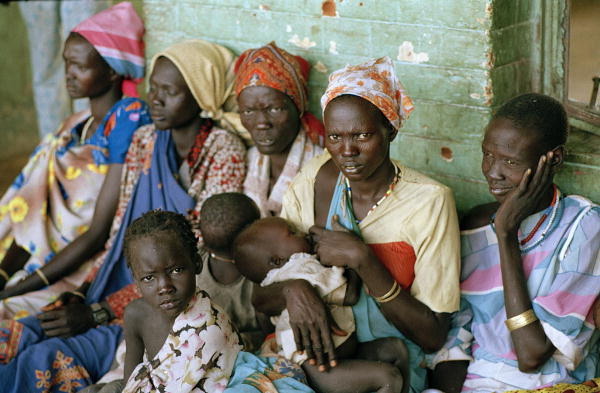 According to modernization theory, poor nations are poor because their people never developed values such as an emphasis on hard work.
United Nations Photo – OLS Brings Support to Strained Medical Services – CC BY-NC-ND 2.0.
According to modernization theory, nations in other parts of the world never became wealthy and remain poor today because they never developed the appropriate values and practices. Instead, they continued to follow traditional beliefs and practices that stymied industrial development and modernization.
Modernization theory has much in common with the culture of poverty theory discussed in Chapter 8 “Social Stratification”. It attributes the poverty of poor nations to their failure to develop the “proper” beliefs, values, and practices necessary for economic success both at the beginning of industrialization during the 19th century and in the two centuries that have since transpired. Because modernization theory implies that people in poor nations do not have the talent and ability to improve their lot, it falls into the functionalist explanation of stratification.
As should be clear, modernization theory has direct implications for strategies to reduce global poverty. The theory implies that people in poor nations must learn the proper beliefs, values, and practices to succeed economically. If they do not do so, they will prevent themselves from profiting as fully as possible from the financial aid they get from wealthy nations, with much of this aid thereby being wasted.
Dependency Theory
The structural explanation for global stratification is called dependency theory. Not surprisingly, this theory’s views sharply challenge modernization theory’s assumptions (Packenham, 1992). Whereas modernization theory attributes global stratification to the “wrong” cultural values and practices in poor nations, dependency theory blames global stratification on the exploitation of these nations by wealthy nations. According to this view, poor nations never got the chance to pursue economic growth because early on they were conquered and colonized by European ones. The European nations stole the poor nations’ resources and either enslaved their populations or used them as cheap labor. They installed their own governments and often prevented the local populace from getting a good education. As a result, the colonized nations were unable to develop a professional and business class that would have enabled them to enter the industrial age and to otherwise develop their economies. Along the way, wealthy nations sold their own goods to colonized nations and forced them to run up enormous debt that continues to amount today. Because dependency theory implies that poor nations remain poor because of lack of opportunity owing to exploitation by wealthy nations, it falls into the conflict perspective on stratification.
In today’s world, huge multinational corporations continue to exploit the labor and resources of the poorest nations, say dependency theorists. These corporations run sweatshops in many nations, in which workers toil in inhumane conditions at extremely low wages (Sluiter, 2009). Often the corporations work hand-in-hand with corrupt officials in the poor nations to strengthen their economic stake in the countries. An example of this dynamic occurred during the 1990s in the poor western African country of Nigeria, where the Royal Dutch/Shell oil company at the time was pumping half of that nation’s oil. Activists in southern Nigeria began to claim that Shell’s oil drilling was destroying their land and that Shell was paying them too little for their oil. In response to their protests, the government sent in police at Shell’s request, with Shell paying some of the police costs. The police put down the activists’ dissent by destroying several villages and killing 2,000 people (Lewis, 1996).
Dependency theory also has direct implications for strategies to reduce global poverty. Very simply, the theory implies that wealthy nations and multinational corporations must stop exploiting the resources of poor nations. Until that happens, poor nations will be unable to develop their natural resources and to enter the industrial age. Some dependency theorists also say that poor nations should limit their importation of goods from wealthy nations, and that wealthy nations should even be forbidden from investing in poor nations.
Which makes more sense, modernization theory or dependency theory? As with many theories, both make sense to some degree (see the “Learning From Other Societies” box), but both have their faults. Modernization theory places too much blame on poor nations for their own poverty and ignores the long history of exploitation of poor nations by rich nations and multinational corporations alike. For its part, dependency theory cannot explain why some of the poorest countries are poor even though they were never European colonies; neither can it explain why some former colonies such as Hong Kong have been able to attain enough economic growth to leave the rank of the poorest nations. Together, both theories help us understand the reasons for global stratification, but most sociologists would probably favor dependency theory because of its emphasis on structural factors in the world’s historic and current economy.
World Systems Approach
Immanuel Wallerstein’s (1979) world systems approach uses an economic basis to understand global inequality. Wallerstein conceived of the global economy as a complex system that supports an economic hierarchy that placed some nations in positions of power with numerous resources and other nations in a state of economic subordination. Those that were in a state of subordination faced significant obstacles to mobilization.
Core nations are dominant capitalist countries, highly industrialized, technological, and urbanized. For example, Wallerstein contends that the United States is an economic powerhouse that can support or deny support to important economic legislation with far-reaching implications, thus exerting control over every aspect of the global economy and exploiting both semi-peripheral and peripheral nations. We can look at free trade agreements such as the North American Free Trade Agreement (NAFTA) as an example of how a core nation is able to leverage its power to gain the most advantageous position in the matter of global trade.
Peripheral nations have very little industrialization; what they do have often represents the outdated castoffs of core nations or the factories and means of production owned by core nations. They typically have unstable governments, inadequate social programs, and are economically dependent on core nations for jobs and aid. There are abundant examples of countries in this category, such as Vietnam and Cuba. We can be sure the workers in a Cuban cigar factory, for example, which are owned or leased by global core nation companies, are not enjoying the same privileges and rights as U.S. workers.
Semi-peripheral nations are in-between nations, not powerful enough to dictate policy but nevertheless acting as a major source for raw material and an expanding middle-class marketplace for core nations, while also exploiting peripheral nations. Mexico is an example, providing abundant cheap agricultural labor to the U.S., and supplying goods to the United States market at a rate dictated by the U.S. without the constitutional protections offered to United States workers.
Key Takeaways
- The world is greatly stratified. A relatively small number of nations holds most of the world’s wealth and income.
- It is useful to classify the world’s nations as wealthy nations, middle-income nations, and poor nations. These three groups of nations differ dramatically in their standard of living and many other aspects of human existence.
- It is important for several reasons to measure global poverty and global inequality. These measures indicate which countries are most in need of help, and they help remind us of the problems they measure.
- According to modernization theory, rich nations became rich because their peoples possessed certain values, beliefs, and practices conducive to the acquisition of wealth. Poor nations remained poor because their peoples did not possess these values, beliefs, and practices and never developed them.
- According to dependency theory, poor nations have remained poor because they have been exploited by rich nations and by multinational corporations.
- According to world systems theory, the global stratification of nations is a complex system that supports an economic hierarchy that placed some nations in positions of power with numerous resources and other nations in a state of economic subordination.
Self Check
References
Alkire, S., & Santos, M. E. (2010). Acute multidimensional poverty: A new index for developing countries. Oxford, England: Oxford Poverty & Human Development Initiative, University of Oxford.
Dikhanov, Y. (2005). Trends in global income distribution, 1970–2000, and scenarios for 2015. New York, NY: United Nations Development Programme.
Haughton, J., & Khandker, S. R. (2009). Handbook on poverty and inequality. Washington, DC: World Bank.
Hoffman, K., & Centeno, M. A. (2003). The lopsided continent: Inequality in Latin America. Annual Review of Sociology, 29(1), 363–390.
Huy, N. Q. (2010). Coffee production and consumption in Vietnam. Retrieved from http://www.docstoc.com/docs/27139628/COFFEE-PRODUCTION-AND-CONSUMPTION-IN-VIETNAM-Prepared-by-Nguyen-.
Neckerman, K. M., & Torche, F. (2007). Inequality: Causes and consequences. Annual Review of Sociology, 33(1), 335–357.
Nolan, P., & Lenski, G. (2009). Human societies: An introduction to macrosociology (11th ed.). Boulder, CO: Paradigm.
Population Reference Bureau. (2009). 2009 world population data sheet. Washington, DC: Author.
United Nations Development Programme. (2005). Human development report 2005. New York, NY: Author.
